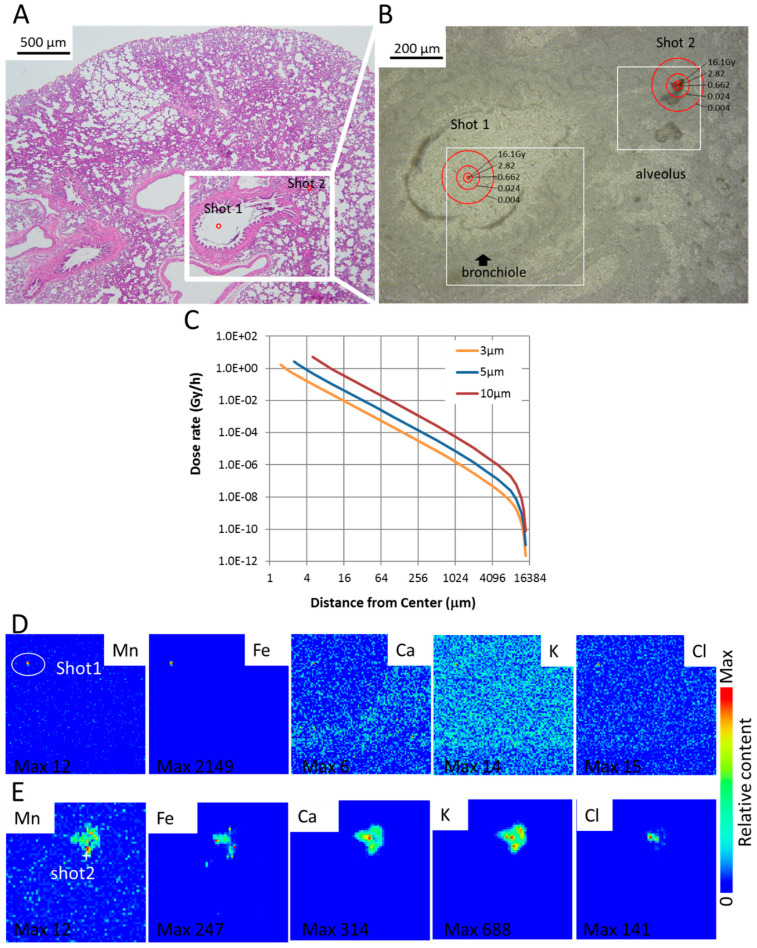
Figure 5.
Early elementary profile, histopathologic image and electron dose rate in lung tissue 6 h after 56Mn(2×) internal exposure. (A) Shot1, located in the bronchiole cavity and Shot2, located in the damaged tissue of the alveolus are observed particles of manganese and iron. H&E stain, 4× objective magnification; (B) As can be seen, a 5-μm-diameter particle has a 5.4-Gy/h absorbed dose rate immediately following intake and 16.1-Gy accumulated dose for 6 h at 2.5 μm measured from the center; (C) dose rate for 56Mn. The dose rate depended on the diameter of the particle (3, 5 and 10 μm). Larger diameter particles showed higher dose rate. Elementary imaging (beam size: 1 μm × 1 μm) of Shot1 (D) (5 μm step, 500 × 500 μm) and Shot2 (E) (5 μm step, 300 × 300 μm) of boxed areas marked in (B) are shown. Maximum concentrations are Shot1; Mn 2900 μg/g, Fe 530,000 μg/g and Shot2; Mn 2900 μg/g, Fe 61,000 μg/g. Corresponding serial section stained with H&E (A) and converted to grayscale is shown in (B).

