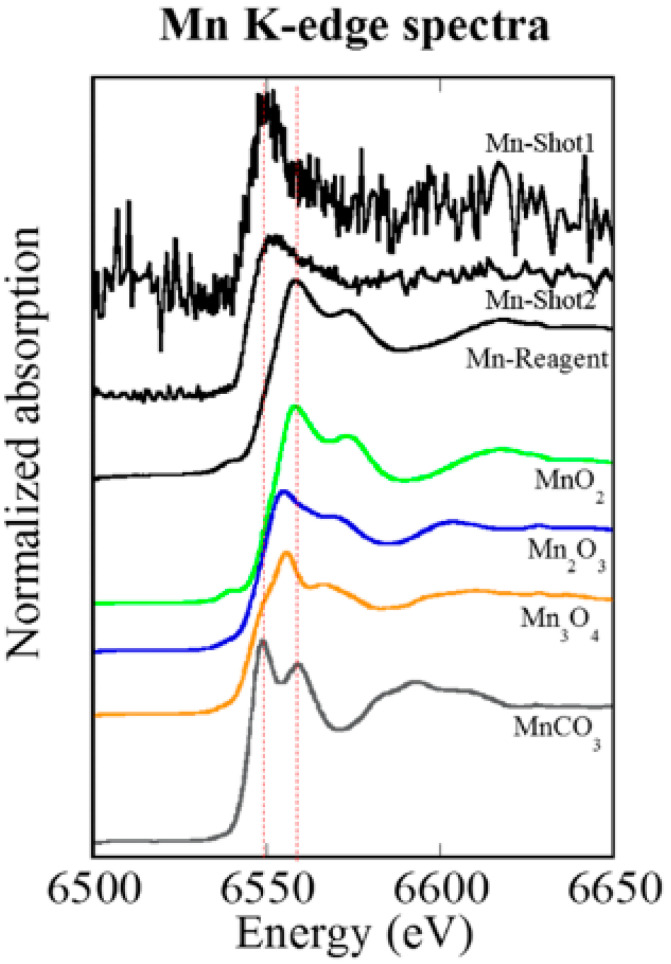
Figure 6.
Mn K-edge XANES spectra (in Figure 5), located in the bronchiole cavity (Shot1) and located in the damaged tissue of the alveolus (Shot2), 6 h after 56Mn(2×) internal exposure. The Mn K-edge XANES spectra both of Shot1 and Shot2 were different from that of Mn reagent and MnO2, but similar to that of MnCO3 solution. The red dotted lines indicate locations of peaks observed in MnCO3 solution. The special similarities indicate that Mn is not in the Mn4+ (Mn reagent, MnO2), but is Mn2+(MnCO3).

