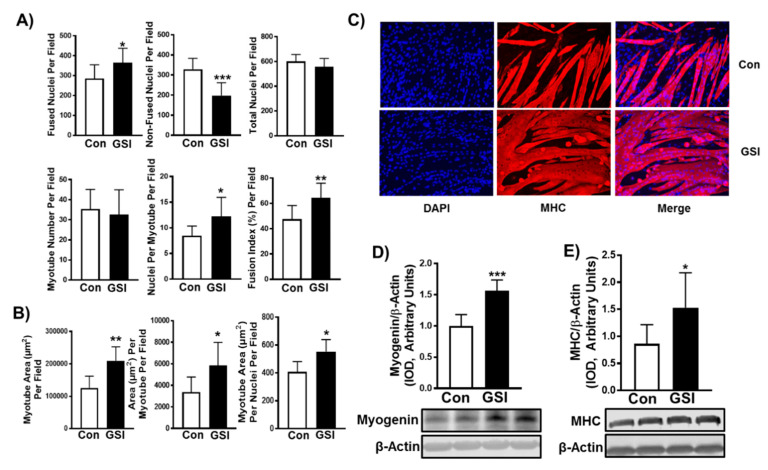
Figure 2.
GSI increases myotube formation in differentiating C2C12 myotubes. (A) Indices of myotube fusion. Graph order, top left to right: Fused nuclei per field, Non-fused nuclei per field, and Total nuclei per field. Graph order, bottom left to right: Myotube number per field, Nuclei per myotube per field, Fusion index per field. (B) Indices of myotube hypertrophy. Graph order: Myotube area (µm) per field, Area (µm) per myotube per field, Myotube area (µm) per nuclei per field. (C) Representative image of 96-h myotubes co-stained with myosin heavy chain (MHC:red) and DAPI:blue. Images were taken at 20× magnification and the scale bar = 50 µm. (D) Myogenin/β-Actin; (E) MHC/β-Actin expression (Integrated optical density, IOD) in 96-h myotubes treated with or without 4 µm γ-secretase inhibitor (GSI) every 12 h. For Western blot representative images: lanes 1 and 2 are Con; lanes 3 and 4 are GSI. Thirty minutes prior to collection all cells were treated with 1µm puromycin. Data were analyzed using a Student’s T-test. * p ≤ 0.05 vs. Control (Con); ** p < 0.01 vs. Con; *** p < 0.001 vs. Con (n = 3 experiments). Data are mean ± SD.

