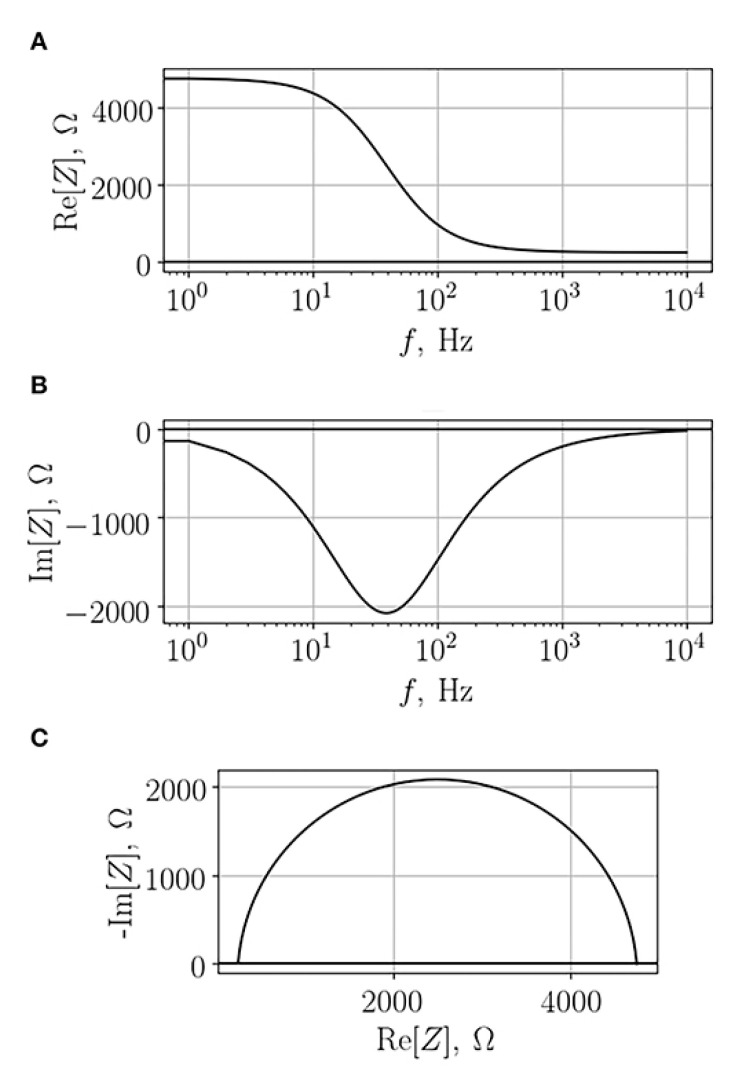
Figure 4.
Typical electrochemical impedance spectroscopy (EIS) spectra obtained from a monolayer of cells. (A) The real component of the Bode plot, (B) the imaginary component of the Bode plot, and (C) the Nyquist plot in which the real impedance is plotted against the imaginary one. Adapted from Gerasimenko et al. [36] under Creative Commons Attribution License.

