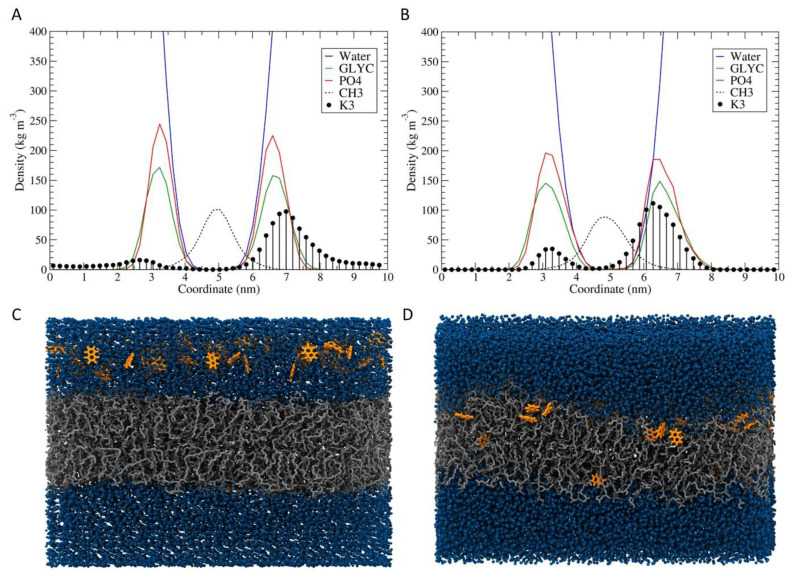
Figure 9.
Average density profiles and snapshots conformations for the beginning and the end of menadione with POPG bilayer simulation. Initially (A,C) The menadione molecules (orange) were distributed above the membrane (grey). In the end (B,D), several went through the membrane and allowed the entry of water molecules (blue spheres) in the hydrophobic regions. The density curves shown are: water (blue lines), phosphate groups (red), glycerol groups (green), acyl chains (black dots), and menadione molecules (black circles).

