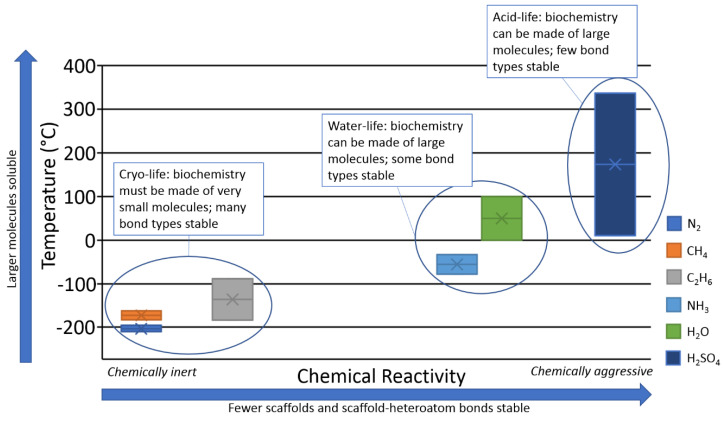
Figure 8.
Schematic representation of the viability of different solvents for complex biochemistry, as a function of chemical reactivity. Y axis: Temperature in °C. X axis: Qualitative estimation of chemical reactivity of a solvent. The height of each bar represents the temperature range of a liquid phase of a solvent (at 1 bar).

