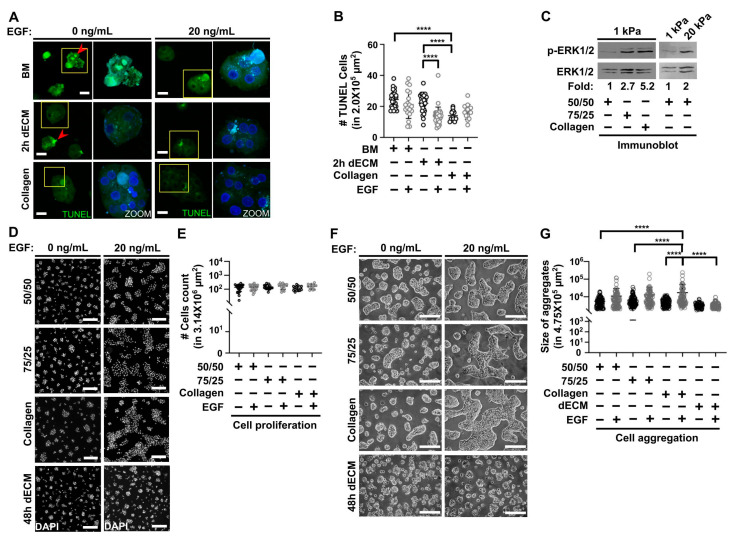
Figure 3.
Collagen type I and epidermal growth factor (EGF) stimulation regulates cell viability and aggregation in primary hepatocytes cultured on soft PAA HGs. (A) 3D projections of representative fluorescence confocal microscopy images of hepatocytes positive to TUNEL in soft PAA HGs conjugated with collagen, BM and 2 h dECM in the absence or presence of recombinant EGF (20 ng/mL) after 72 h of culture. Apoptotic hepatocytes with double-strand DNA breaks: red arrowheads. Images were obtained from a 40× objective. Scale bar: 20 μm. (B) Quantification of positive TUNEL cells in soft PAA HGs conjugated with collagen I, BM, or 2 h dMEC in the absence or presence of EGF [20 ng/mL]. Data are represented as the mean ± SD of 2 independent experiments; **** p < 0.0001. (C) phospho- extracellular signal-regulated kinases 1/2 (ERK1/2) and ERK1/2 immunobotting in hepatocytes cultured on 1 kPa and 20 kPa PAA HGs conjugated with different ECM after 24 h of culture. Data presented are representative of 2 independent experiments. Numbers below blots indicate the densitometric ratio values of phospho-ERK1/2 and total ERK1/2 protein, expressed in fold changes. (D) Representative fluorescence images of nuclei (DAPI) in hepatocytes after 72 h of culture on soft PAA HGs conjugated with different ECMs in the absence or presence of EGF (20 ng/mL). Images obtained using a 10X objective. Scale bar: 200 μm. (E) Cells count graph of conditions depicted in (D). (F) Representative DIC images of aggregates of primary hepatocytes cultured on 1 kPa PAA-HGs linked to different ECMs in the absence or presence of EGF (20 ng/mL) at 72 h of culture. Images were obtained from a 20x objective. Scale bar: 200 μm. (G) Quantification of size of cell aggregates in the conditions depicted in (F). ECM mixtures: BM, 100% Matrigel; 50/50, 50% collagen type I puls 50% BM; 75/25, 75% collagen type I plus 25% BM; collagen, 100% collagen type I; 2 h dECM, dECM after 2 h of digestion; 48 h dECM: ECM after 48 h of digestion. Data are represented as mean ± SD of 2 independent experiments; **** p < 0.0001.

