Figure 5.
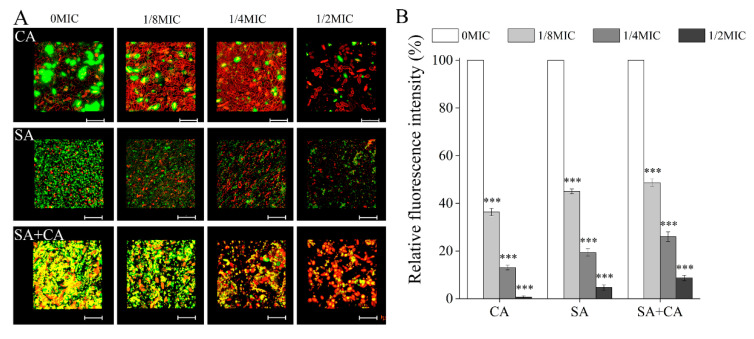
Effects of different concentrations of chelerythrine on the levels of extracellular polysaccharides inside C. albicans (CA) and S. aureus (SA) mono- and dual-species (SA+CA) biofilms. (A) Extracellular polysaccharides were stained with a green fluorescent stain wheat germ agglutinin, and C. albicans and S. aureus cells were labelled with a red lipophilic membrane dye FM 4-64. Scale bars represent 10 μm. (B) The relative fluorescence intensity of extracellular polysaccharides in biofilms of each treatment group was plotted against that in untreated group by measuring green fluorescence ratios using KS 400 version 3.0 software. Bars represent the standard deviation (n = 3). *** p < 0.001.

