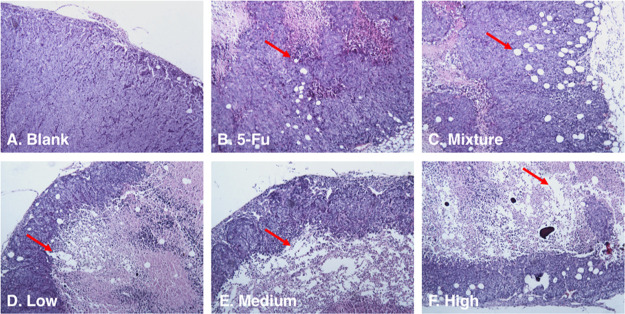
Figure 3.
Histology (H & E ×100) results of the tumor are compared. (a) Blank control group. (b) Positive control group (0.036 mmol/kg/d 5-FU). (c) Mixture group, the group treated with the compounds 5-FU and NCM in a non-co-crystallized form at a 3:1 molar ratio (0.036 mmol/kg/d 5-FU + 0.012 mmol/kg/d NCM). (d–f) Groups treated with 5-FU-NCM at different concentrations [(d) 0.006 mmol/kg/d; (e) 0.012 mmol/kg/d; (f) 0.018 mmol/kg/d].

