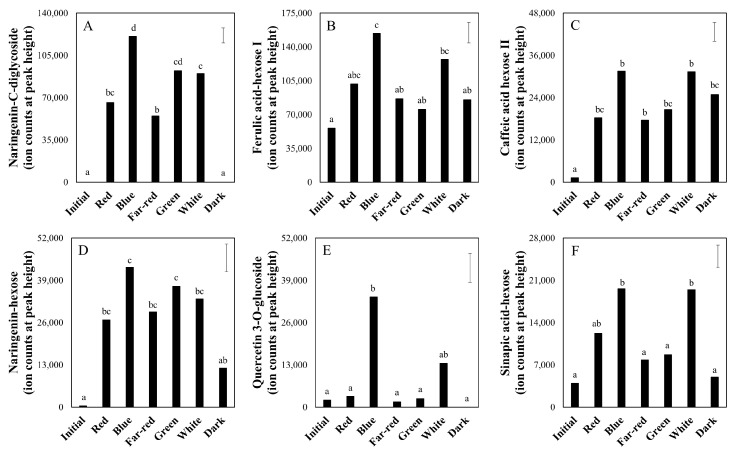
Figure 8.
Relative levels of selected metabolites in tomato pericarp from experiment 2, measured by LC-MS. The fruits were treated with white light (background) supplemented with monochromatic red, blue, far-red and green light, and broad-spectrum white light (white) or no light at all (dark) for seven days. Error bars indicate the least significant difference; letters (A–F) indicate significant differences between light treatments at α = 0.01, n = 3 (three pools of two fruits each).

