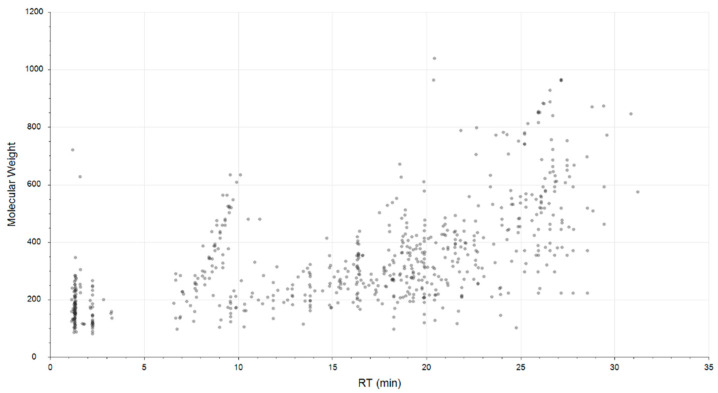
Figure 1.
Plot representing the distribution of molecular weight versus retention time (RT) of filtrated features obtained in LC-MS analysis, electrospray ionization in positive ion mode (ESI+). Details of detected features are presented in Table S1.

