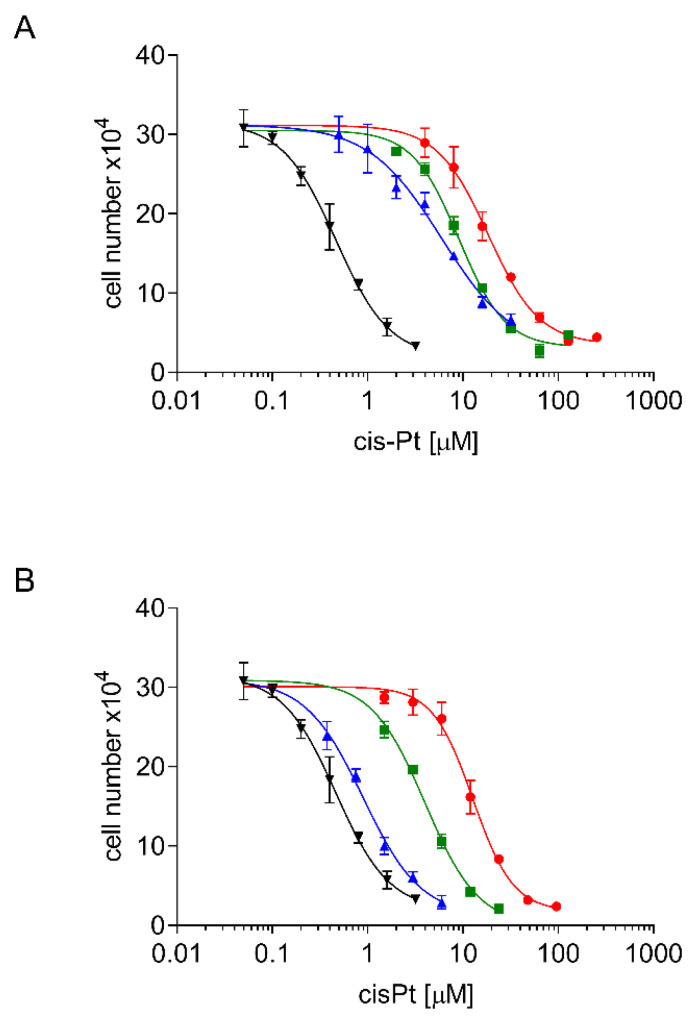
Figure 3.
Dose response curves of induced (A) and de-induced (B) A24 sublines. Cells were seeded at densities of 2–8 × 10⁴ mL−1 and subsequently grown in cisplatin containing medium (0–512 µM). Cell densities were measured after three days. A24 (-▼-), A24/(D-)A24cisPt2.0 (-▲-), A24/(D-)A24cisPt4.0 (-■-), A24/(D-)A24cisPt8.0 (-●-). Data are presented as mean ± standard deviation (SD). n > 10.

