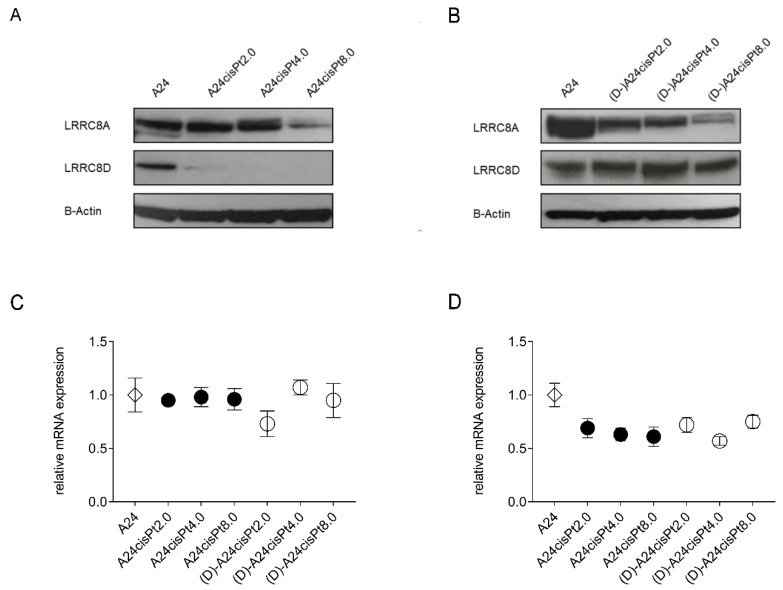
Figure 6.
Western Blot illustrating LRRC8A and LRRC8D subunits expression in induced (A) and de-induced (B) A24 sublines. mRNA levels of LRRC8A (C) and LRRC8D (D) were quantified by RT-qPCR. Western blots are representative of 3 independent repeated experiments. Data are presented as mean ± SD. n = 3.

