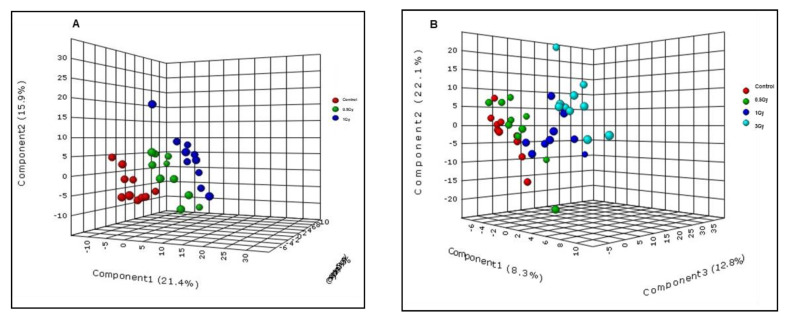
Figure 5.
Alterations in mouse plasma metabolite profiles in response to 1H and γ-irradiation. Panel (A): PLS-DA plot showing ANOVA comparison of samples from 0.5 Gy and 1 Gy exposed mice versus control (sham) in response to 1H irradiation in the negative ionization mode. Panel (B): PLS-DA plot showing ANOVA comparison of 0.5 Gy, 1 Gy and 3 Gy-irradiated samples versus control (sham) after exposure to γ-irradiation in the negative ionization mode.

