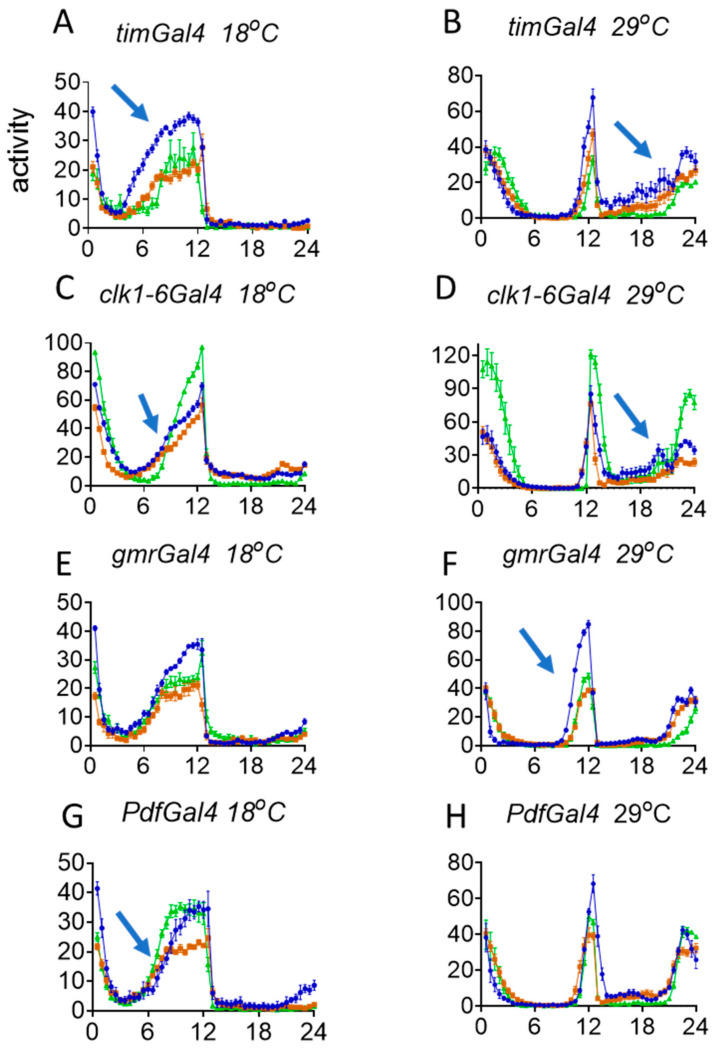
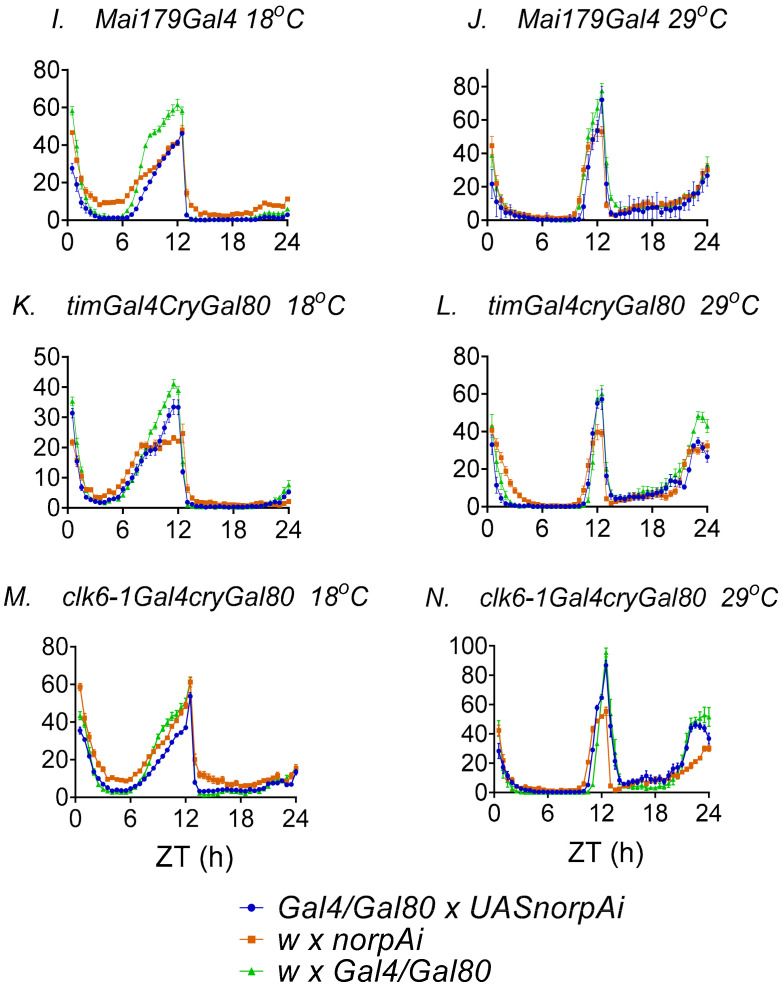
Figure 4.
Locomotor activity: norpA RNAi in clock cells under different temperatures. norpA RNAi and locomotor behaviour. (A–N) Gal4/Gal80 Genotypes and temperature given above each panel. Y axis, mean locomotor event/30 min time bin. X axis, ZT, ZT 0–12 light, ZT 12–24 dark. Blue trace is experimental Gal4/Gal80 x UASnorpAi; brown is w x UASnorpAi; green is w x Gal4/Gal80. Mean +/- sem. Blue arrows show significant effects via Kruskal–Wallis ANOVA and Dunn post-hoc test of EZt50 and MZt50, where the experimental (blue) genotype was significantly different from both control (brown, green) genotypes. EZt50 and MZt50 allow normalisation of the total levels of activity among genotypes.


