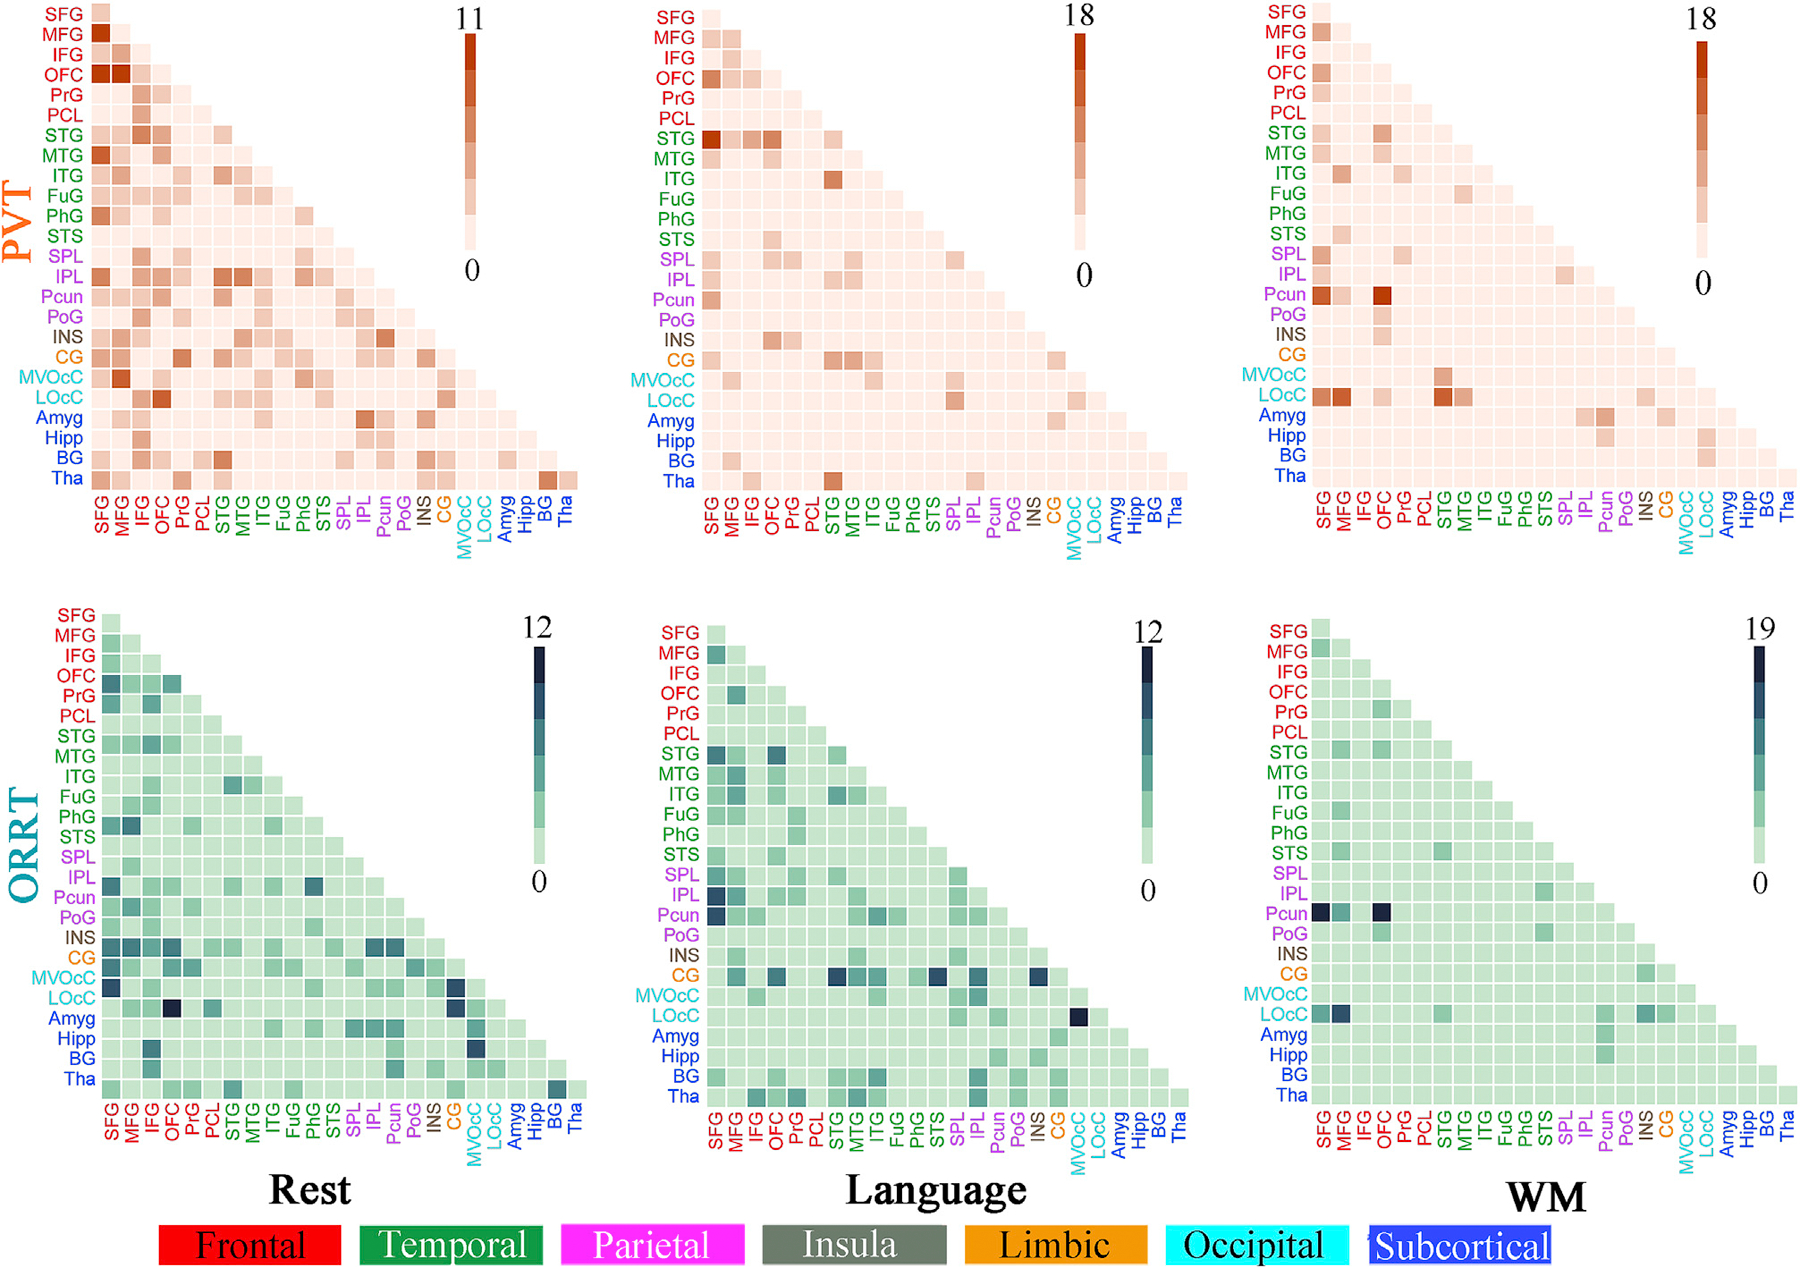
Fig. 5.

The number of significantly predictive edges between each macroscale brain region pair determined by permutation tests under the threshold of p < 0.05. As shown in the circle and matrix plot, the 246 FC nodes are grouped into 24 macroscale brain regions that are anatomically defined by the Brainnetome atlas. Cells in the matrix plots are plotted as number of edges within and between each pair of brain regions.
