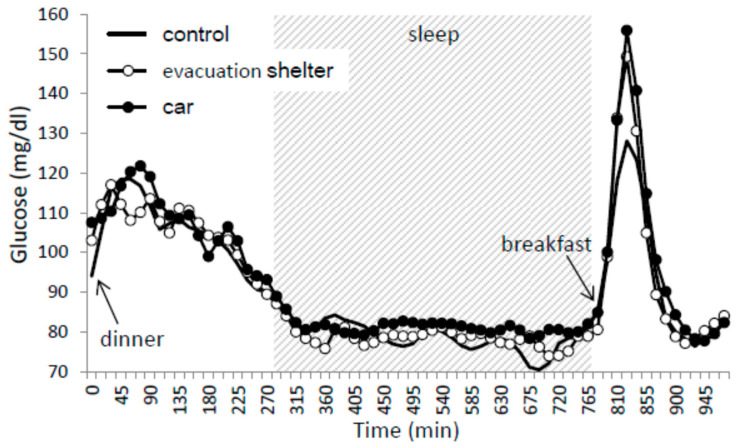
Figure 2.
Time course of glucose from dinner to 3 h after breakfast. Mean values of blood glucose for nine subjects were plotted every 15 min. The black lines show data for the control trial, the open circles show data for evacuation shelter trials, and the closed circles show data for the car trial. Sleep hours are indicated in the gray zone.

