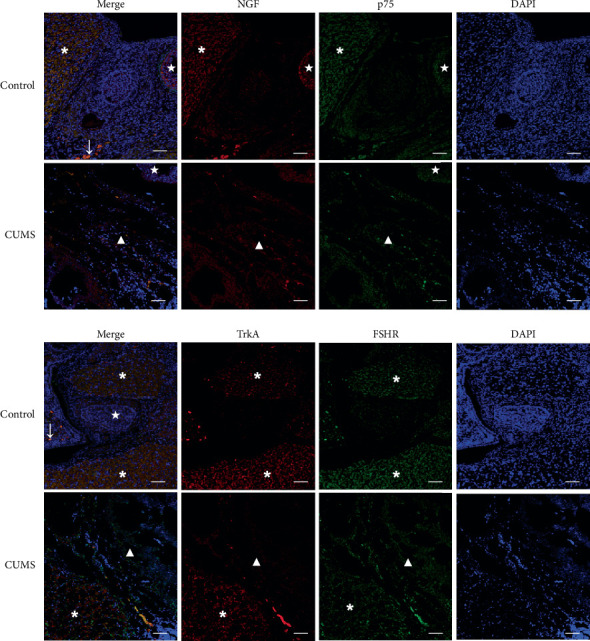
Figure 4.

Immunofluorescence localization of NGF, p75, TrkA, and FSHR proteins in the ovarian tissues of CUMS rats Tissues were stained for NGF using TRITC-labeled secondary antibody (red), and for p75 using FITC-labeled secondary antibody (green). Nuclei were stained using DAPI (blue). Tissues were stained for TrkA using TRITC-labeled secondary antibody (red) and for FSHR using FITC-labeled secondary antibody (green). Nuclei were stained using DAPI (blue). In the figure, the ∗ symbol indicates corpus luteum, ★ indicates antral follicles, ↓and small follicles, and ▲ indicates ovarian stroma, scale bar = 50 μm. Values are 10 in the control group and 30 in the CUMS group, respectively.
