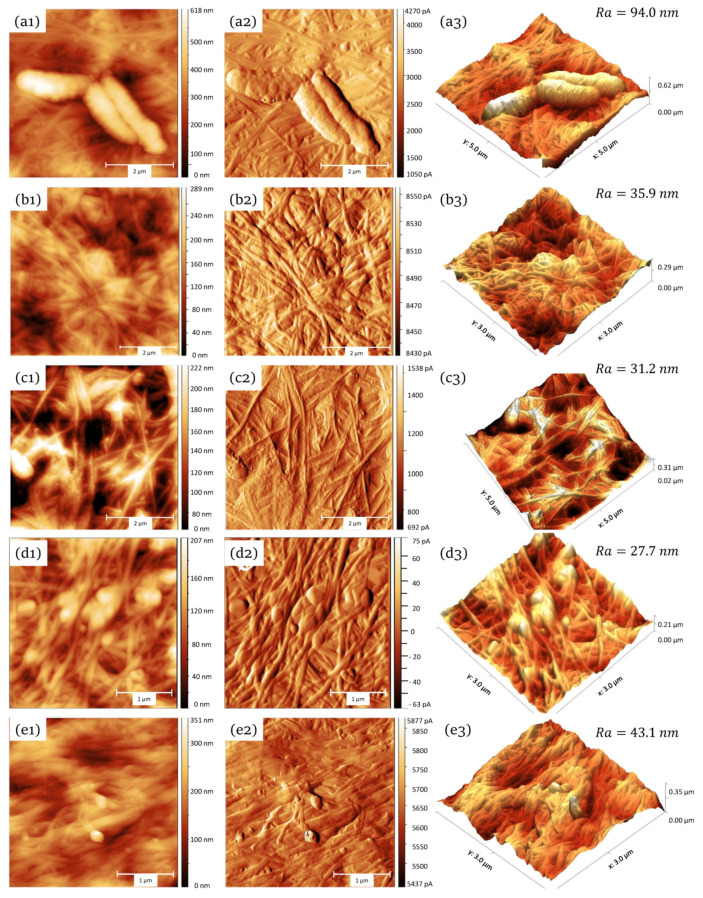
Figure 5.
Samples surface topography obtained by atomic force microscopy (AFM): first row (a): crude BC with three attached bacterial cells; second row (b): decellularized (“purified”) BC totally free from bacterial cells; third row (c): younger decellularized BC matrix (4 days growth time), with higher diversity in the fibril size; forth row (d) BC impregnated with calcium phosphate; fifth row (e) BC impregnated with silver nanoparticles. The first column (1) represents the two-dimensional images of the surface. The second column (2) displays the maps of cantilever displacement amplitudes. The last column (3) shows the reconstructed three-dimensional models and the mean deviation surface roughness .

