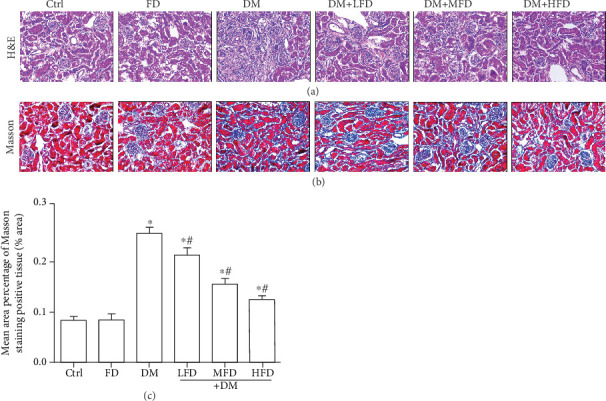
Figure 2.

The pathological changes of renal tissues in each group. (a) Representative images of H&E staining for each group, light microscopy (400×). (b) Representative images of the Masson staining for each group, light microscopy (400×). (c) Mean area percentage of the Masson staining-positive tissue in renal tissue specimens. Data are expressed as mean ± SD, ∗P < 0.05 vs. the Ctrl group; #P < 0.05 vs. the DM group.
