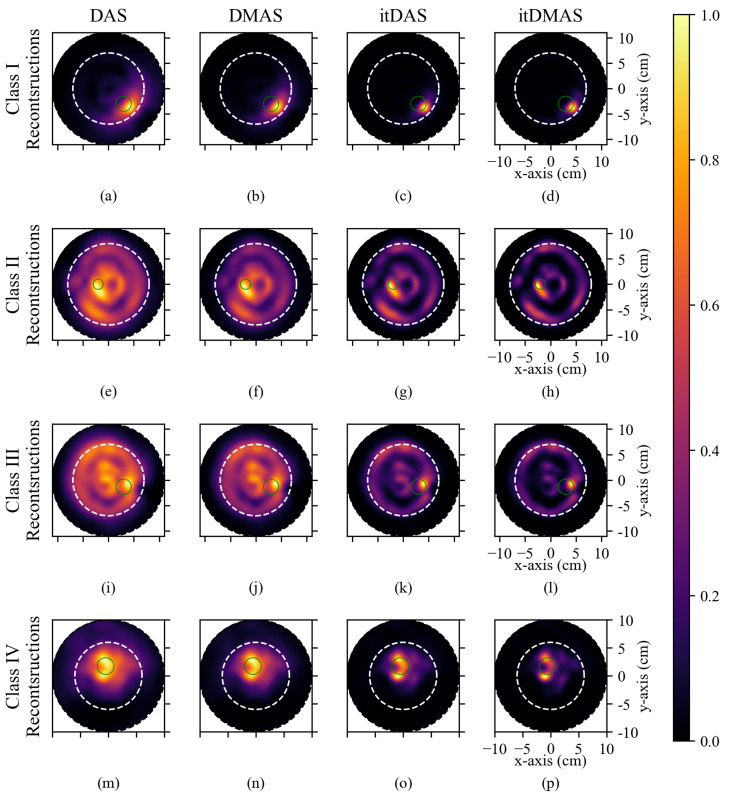
Figure 3.
Reconstructions of breast phantoms by (left to right) the DAS, DMAS, itDAS, and itDMAS beamformers. (a–d) display the reconstructions of a 15 mm radius lesion in a Class I (A2F1) phantom, (e–h) display the reconstructions of a 10 mm radius lesion in a Class II (A3F4) phantom, (i–l) display the reconstructions of a 15 mm radius lesion in a Class III (A2F4) phantom, and (m–p) display the reconstruction of a 15 mm radius lesion in a Class IV (A1F4) phantom. Each image is normalized to its maximum intensity. The dotted black circle indicates the antenna trajectory during the scan, the dotted white line indicates the approximate breast phantom boundary, and the solid green circle indicates the known tumor position.

