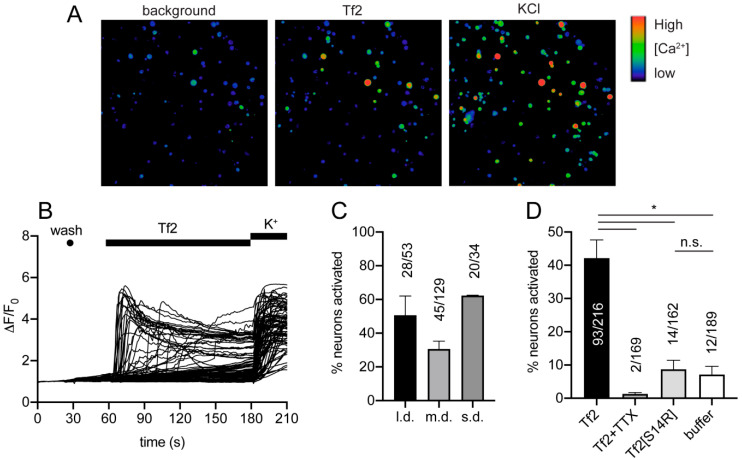
Figure 3.
Tf2 activates mouse dorsal root ganglion neurons. (A) DRG cells before (background) and after the addition of 1 µM Tf2 and 30 mM KCl. (B) Traces from all neurons (defined as cells responding to 30 mM KCl and/or 1 µM Tf2) of one representative experiment. (C) Percentage of large (>600 µm2), medium (300–600 µm2), and small diameter (<300 µm2) neurons activated in the presence of 1 µM Tf2. (D) Percentage of neurons (total) activated in the presence of 1 µM Tf2, 1 µM Tf2 + 1 µM TTX, 1 µM Tf2[S14R], or buffer (negative control). Data are presented as SEM with the total number of neurons from 2–3 independent experiments; l.d., large diameter, m.d., medium diameter; s.d., small diameter; K+, 30 mM KCl; *, p < 0.05 using unpaired t-test; n.s., not significant.

