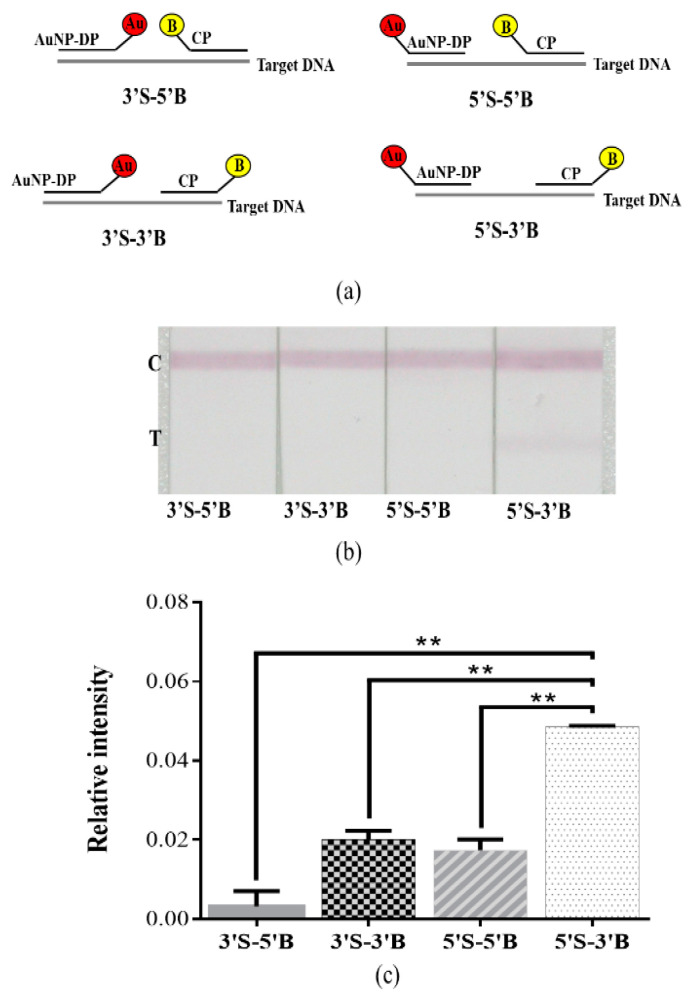
Figure 4.
Effect on signal intensity from the terminus positions of thiol and biotin incorporated at the probe sequence. (a) Diagram of the relative positions of the termini, which had thiol and biotin attached, on the probe sequence for each combination: 3’S-5’B, 3’S-3’B, 5’S-5’B, and 5’S-3’B. (b) Photographic images of the detection of BKV target DNA by the developed lateral flow strip. (c) Relative intensity analyses of (b). The ** p < 0.01; data are presented as the mean and SD.

