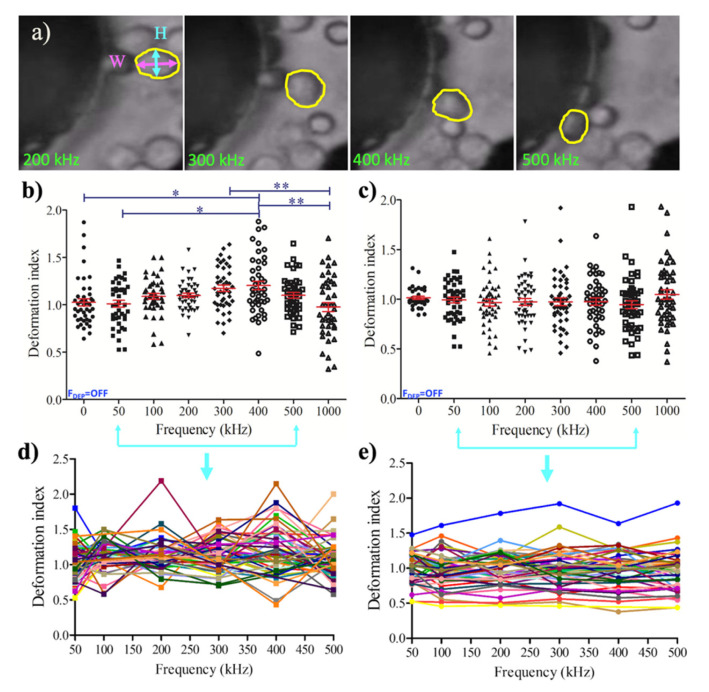
Figure 4.
Dielectrophoretic deformation indexes (DDI) of U937 monocytes and U937-differentiated macrophages: (a) Representative image for the measurement of DDI. DDI values were presented with mean and standard error for population (n = 45). (b) single (n = 47) (d) monocyte cells; 45 population (c), single (n = 47) (e) macrophage cells. Tukey’s multiple comparison test is applied for (b). * and ** indicate that data are significantly different with p < 0.5 and p < 0.05, respectively. Each color displays the change of deformation indexes of single cells during the frequencies applied for the range of 50–500 kHz in (d) and (e).

