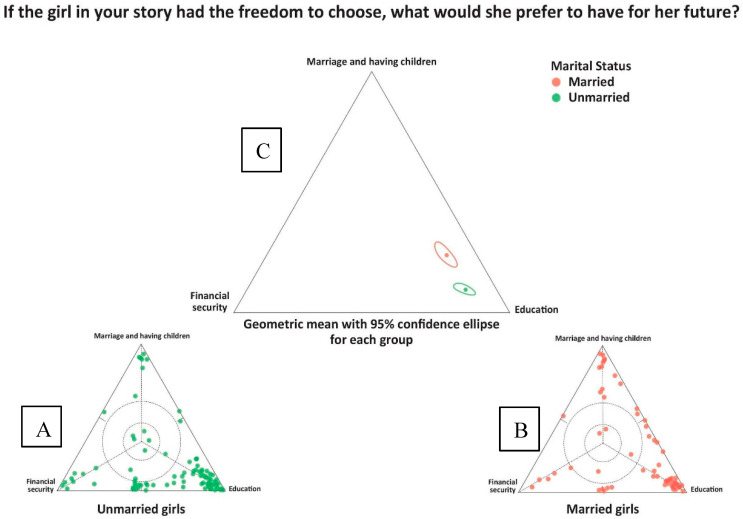
Figure 2.
Individual data points: (A) unmarried girls, n = 111; (B) married girls, n = 77; and the (C) geometric mean with 95% confidence ellipses for all responses within the two subgroups. The question asked was “If the girl in your story had the freedom to choose, what would she prefer to have for her future?”.

