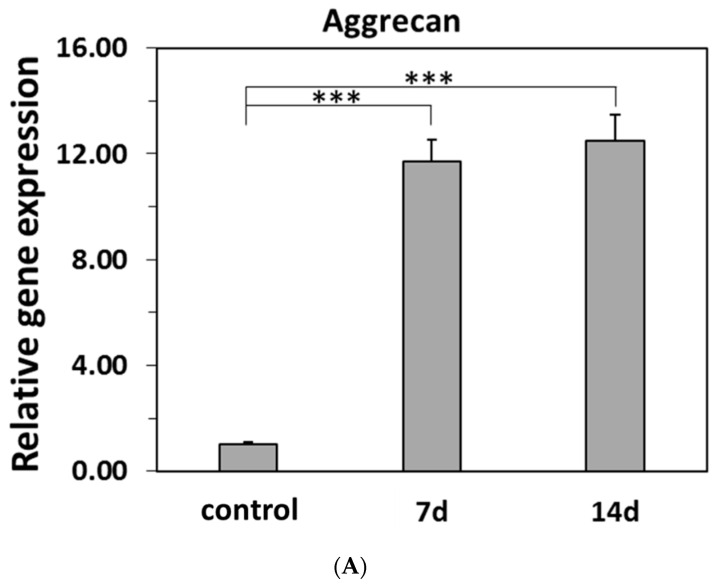
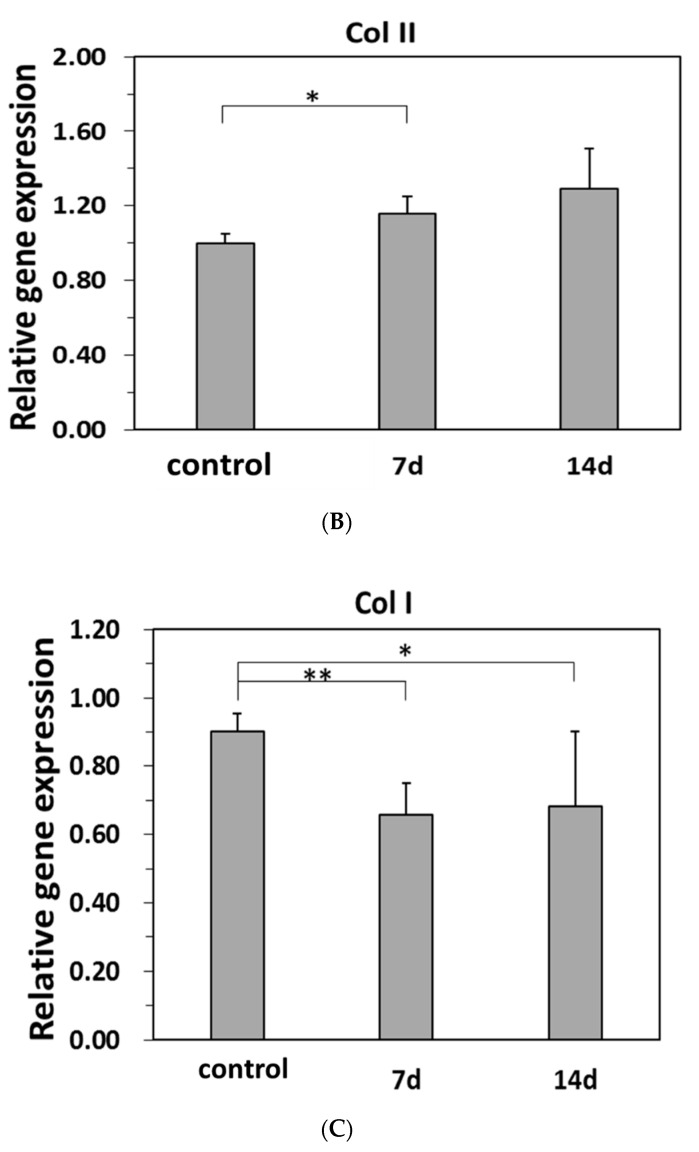
Figure 7.
Real-time PCR analysis for the relative quantities of NP-specific gene expressions of inducing differentiation of hBMSC to NP cells on the model hydrogels for 7 d and 14 d. Gene expressions of AGN (A), COL II (B) and COL I (C) for the control group (e.g., ctrl) were the data for 7 d incubated at cultural wells. (* p < 0.05, ** p < 0.01, ***p < 0.001; data presented are mean ±SD, n = 3).


