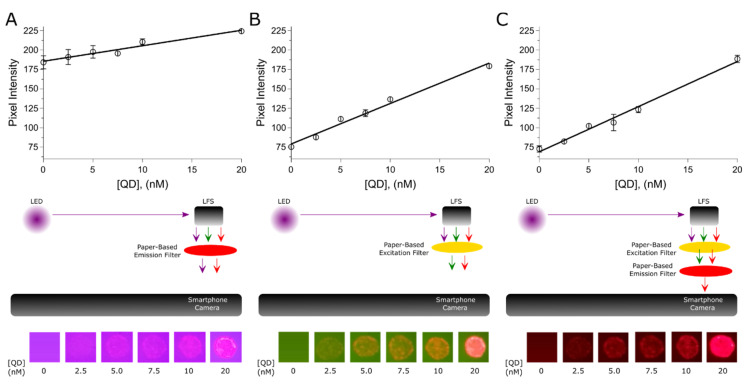
Figure 3.
The resulting calibration plots under different paper-based filter configurations and the corresponding images. (A) Red filter. (B) Yellow filter. (C) Red + yellow filter. The error bars represent the standard deviation of two QD spots drop-casted onto lateral flow strips (LFS). The size of the spots is c.a. 3 mm.

