Figure 2.
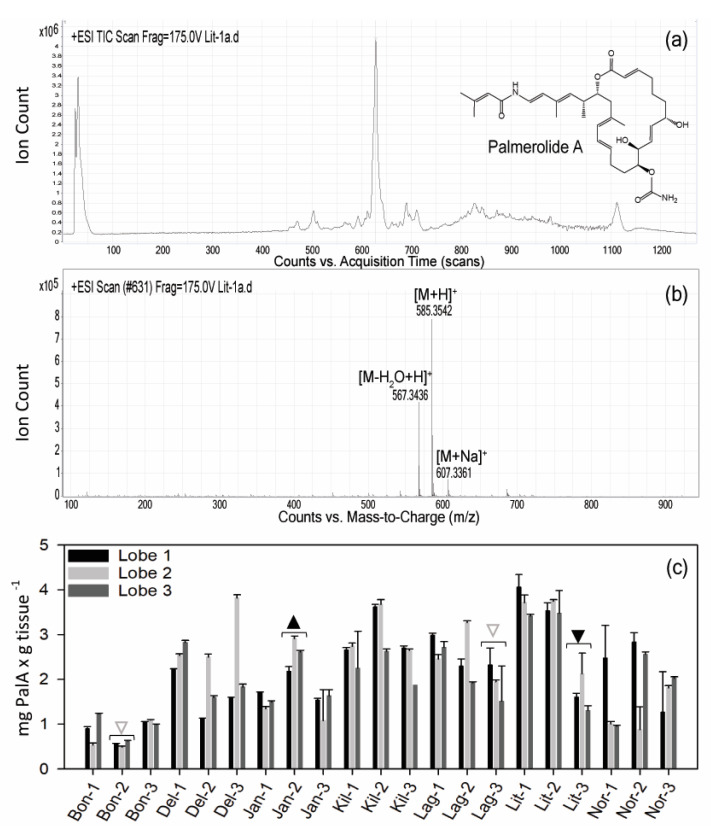
Palmerolide A (PalA) detection in S. adareanum holobionts. (a) Total ion chromatogram derived from sample Lit-1a. The PalA peak dominates the dichloromethane-methanol fraction of the S. adareanum extract. Inset: PalA structure. (b) Mass spectrum of PalA (sample Lit-1a) derived from peak at scan number 631 showing [M – H2O + H]+ (C33H47N2O6 calculated m/z 567.3429), [M + H]+ (C33H48N2O7 calculated m/z 585.3534) and [M + Na]+ (C33H47N2O7Na calculated m/z 607.3359). (c) Levels of PalA normalized to tissue dry weight detected by mass spectrometry in S. adareanum holobiont tissues (three lobes per colony) surveyed in three colonies per site across the Anvers Island Archipelago. Error represents individual lobe technical replication (standard deviation). Colonies with significant differences in PalA levels within a site (e.g., Jan-1:Jan-2) are indicted with triangles, in which the direction of the point indicates a significantly higher or lower colony. Filled triangles indicate significance (p < 0.05) in comparison to the other two colonies, and open triangles are those that were different from only one of the two colonies. Most colonies had significant lobe-to-lobe differences in PalA concentration, and some site-level differences were observed (Figure S1).

