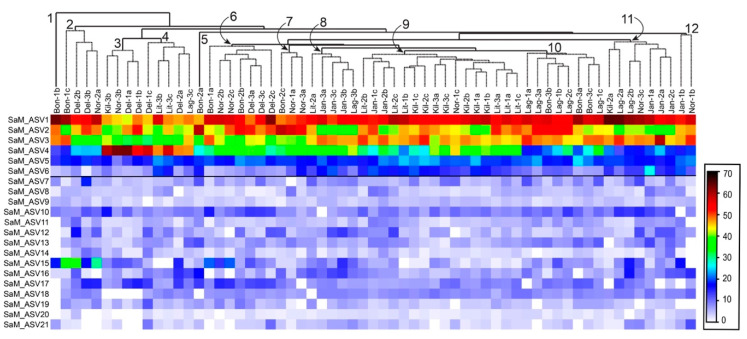
Figure 3.
Heatmap of square root transformed amplicon sequence variant (ASV) occurrence data for the core microbiome. ASVs (ranked and numbered) are shown on the y-axis, and hierarchically clustered samples (63) are shown on the x-axis (site-based; square root transformed abundance data). Nodes with significant clusters are indicated from left to right (p < 0.05); order of clustering inside the node was not significant. The horizontal line drawn below SaM_ASV6 demarcates those ASVs that were present in all 63 samples.

