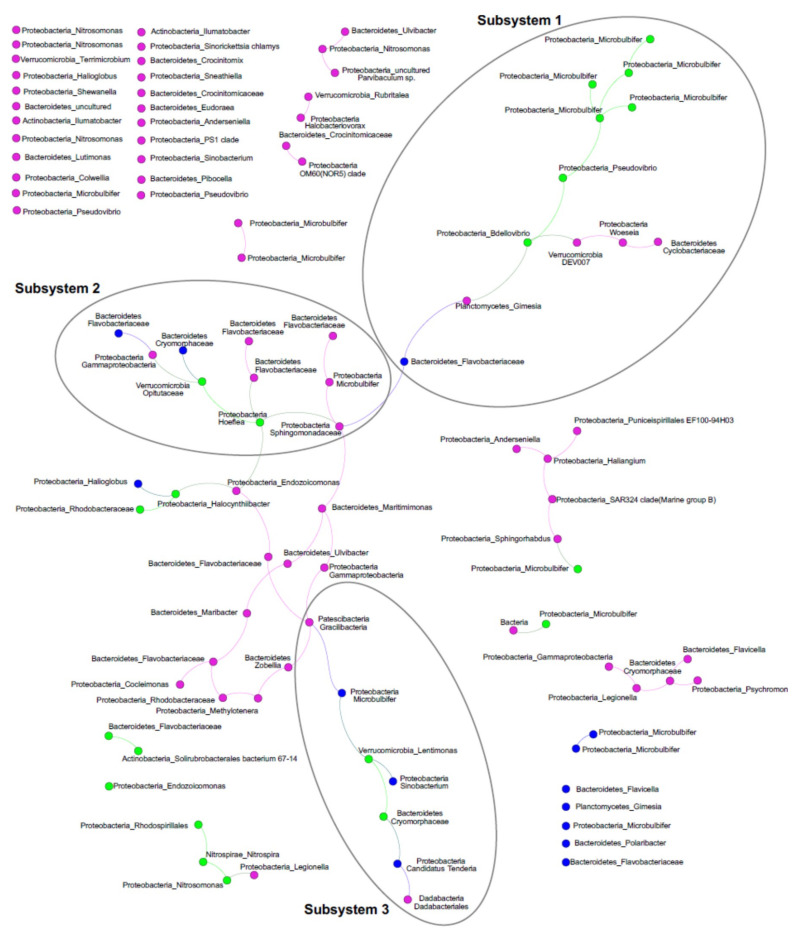
Figure 5.
ASV co-occurrence network. The largest connected component of the co-occurrence network (seeded with ASVs found in at least 5 samples, 102 in total) identified three subsystems. Node colors represent the microbiome fractions (Core80, green; Dynamic50, blue; Variable, pink). Taxonomic identities of the ASVs are shown next to the nodes, with the phylum_highest level taxon identified shown.

