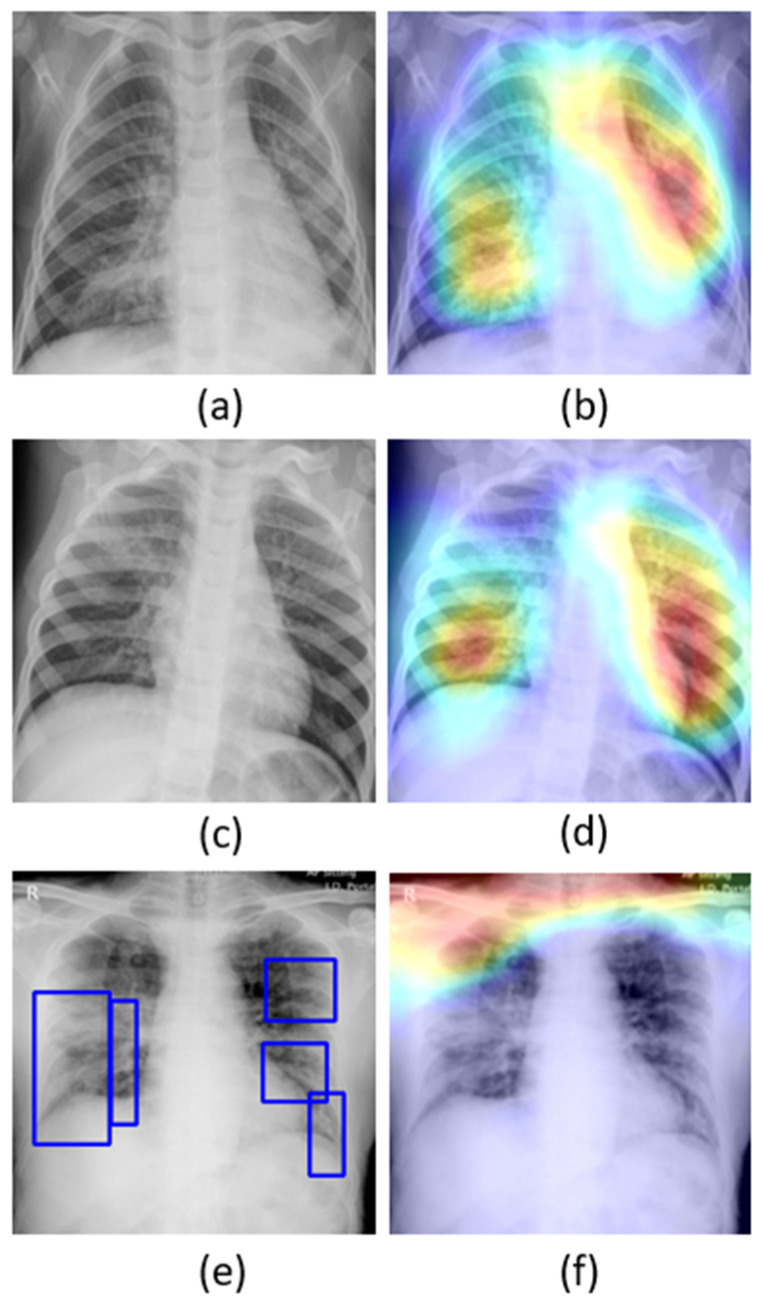
Figure 5.
Original CXRs and their salient ROI visualization: (a,b) show a CXR with bilateral bacterial pneumonia and the corresponding Grad-CAM visualization; (c,d) show a CXR with viral pneumonia manifestations and the corresponding salient ROI visualization; and (e,f) show a sample CXR from the Montreal-COVID-19 CXR collection with ground truth (GT) annotations and corresponding salient ROI visualization. Blue frames in (e) denote radiologist annotations indicating disease regions, which serve as ground truth in our analysis.

