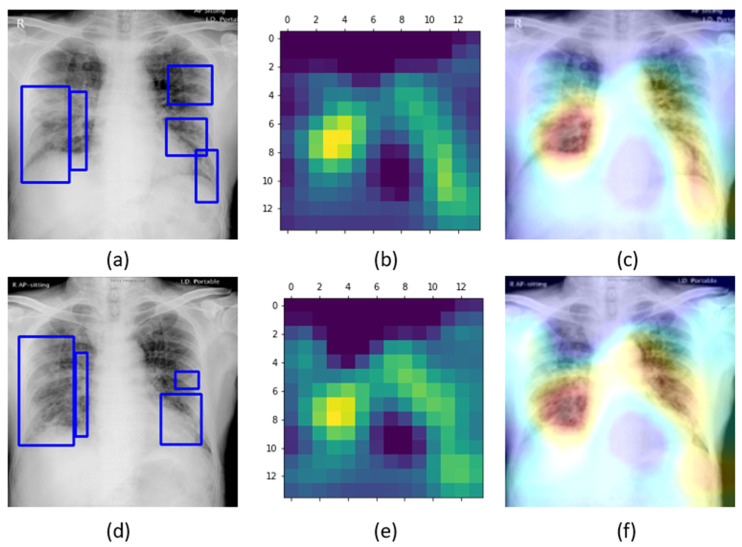
Figure 8.
Original CXRs, heat maps, and salient ROI visualization: (a–c) show a sample Montreal-COVID-19 CXR with GT annotations, the corresponding heat map, and Grad-CAM visualization; (d–f) show a sample Twitter-COVID-19 CXR with GT annotations, the heat map, and its associated class activation maps. Blue frames in (a,d) denote radiologist annotations indicating disease regions, which serve as ground truth in our analysis.

