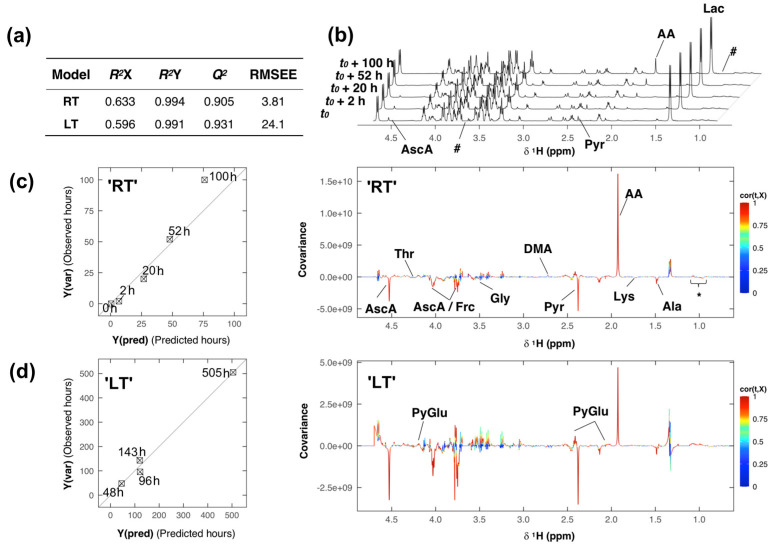
Figure 4.
Sample degradation analysis of the room temperature (‘RT’) and low temperature (‘LT’) samples. (a) Table of partial-least squares (PLS) model performance and quality parameters. (b) 1H NMR spectra of the ‘RT’ sample acquired at different time intervals. (c) (left) Cross-validated predictions for sample ‘RT’, and (right) loading plot derived from the PLS model of sample ‘RT’. (d) (left) Cross validated predictions for sample ‘LT’, and (right) loading plot derived from PLS model of sample ‘LT’. Note: For compound abbreviations, see Table 2; here: * = VAL, LEU, aHBA and bHMB; # = regions where signals of ethanol/isopropanol were deleted.

