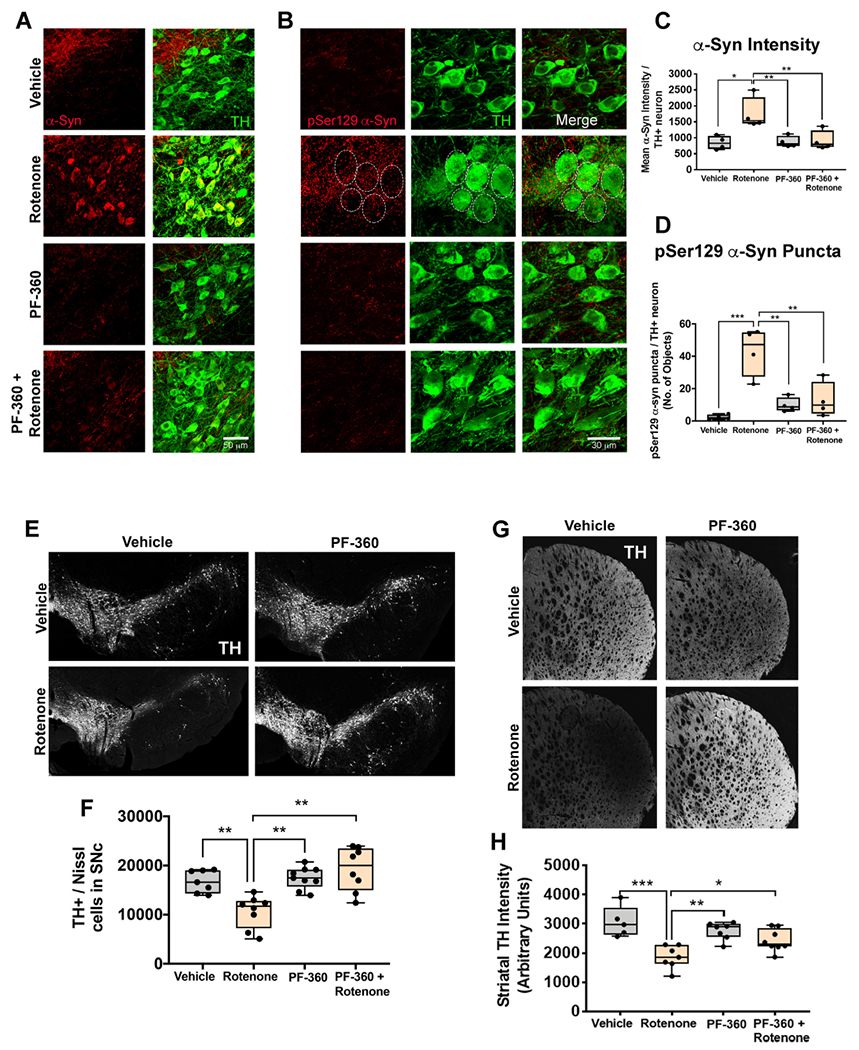
Fig. 8.

LRRK2 kinase inhibition prevented rotenone-induced dopaminergic degeneration and α-synuclein accumulation in rats. Total endogenous α-synuclein levels was assessed in surviving dopaminergic neurons in the substantia nigra in rats treated with endpoint rotenone in the presence or absence of PF-360. Representative photomicrographs of endogenous α-synuclein (Red) in dopaminergic neurons (Green) (A). Endogenous pSer129 α-synuclein levels was assessed in surviving dopaminergic neurons in the substantia nigra in rats treated with endpoint rotenone in the presence or absence of PF-360. Representative photomicrographs of pSer129 α-synuclein (Red) in dopaminergic neurons (Green) (B). Quantification of the average total α-synuclein intensity per nigral dopaminergic neuron; n = 4/grp (C). Quantification of pSer129 α-synuclein puncta per nigral dopaminergic neuron; n = 4/grp (D). Nigrostriatal dopaminergic degeneration was assessed in aged rats treated with endpoint rotenone in the presence or absence of the LRRK2 kinase inhibitor, PF-360 using specific markers; TH for dopaminergic neurons and fluorescent Nissl (Neurotrace) for all neurons. Representative photomicrographs of surviving dopaminergic neurons in the substantia nigra of rats treated with endpoint rotenone in the presence or absence of PF-360 (E). Quantification of the total number of nigral dopaminergic neurons using a semi-automatic stereology protocol; n = 8/grp (F). Photomicrographs of dopaminergic terminals in the striatum of rats treated with endpoint rotenone in the presence or absence of PF-360 using a TH specific antibody (G). Quantification of the average intensity values for dopaminergic terminals using TH; n = 5–8/grp (H). Data are analyzed using two-way ANOVA and Tukey post hoc analysis. *p < .05, ** p < .01, *** p < .001 graphs are expressed as mean ± SEM. Symbols represent individual brain. (For interpretation of the references to colour in this figure legend, the reader is referred to the web version of this article.)
