Figure 1.
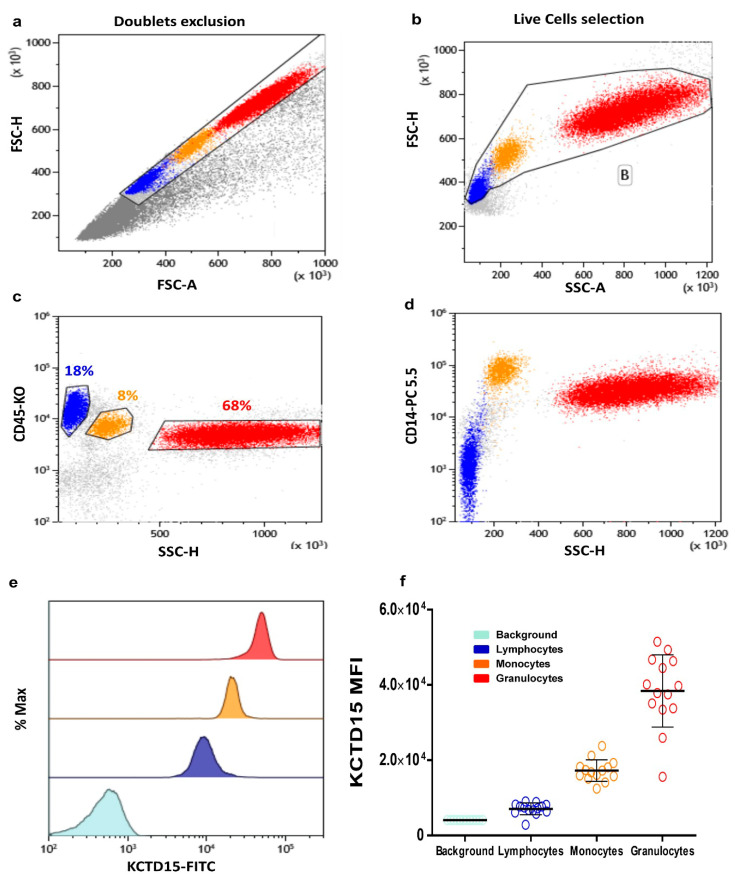
Potassium channel tetramerization domain (KCTD)15 expression in peripheral blood cells. (a) Forward scatter (FSC)-Height vs. FSC-Area dot plot used for the selection of single cells and doublets exclusion. (b) FSC vs. side scatter area (SSC) dot plot for the selection of single live cells. (c) CD45-KO vs. SSC color plot shows the identification of the lymphocytes (blue), monocytes (orange), and granulocytes (red) based on CD45 intensity of expression and light side scatter. (d) CD14-PC 5.5 vs. SSC density plot shows the expression of CD14 for better identification of the monocytes. (e) Overlay histogram showing the increased KCTD15 fluorescence intensity in granulocytes (red), monocytes (orange), and lymphocytes (blue) when compared to II-FITC antibody-labeled peripheral blood (light blue). (f) Scatter plot displaying the mean value of KCTD15 fluorescence intensity with standard deviations (SD) for the background (turkey circles; mean = 4089, SD = 1814), for lymphocytes (blue circles; mean = 7030, SD = 1572), for monocytes (orange circles; mean = 17,223, SD = 2863) and granulocytes (red circles; mean = 38.371, SD = 9597), as derived from the 14 cases studied here. The differences of KCTD15 fluorescence intensity of lymphocytes, monocytes, and granulocytes, compared to the background, are highly significant (p < 0.001, unpaired t-tests in all cases). Moreover, the difference detected for granulocytes vs. lymphocytes, granulocytes vs. monocytes, and lymphocytes vs. monocytes are also significant (p < 0.001, unpaired t-tests in all cases).

