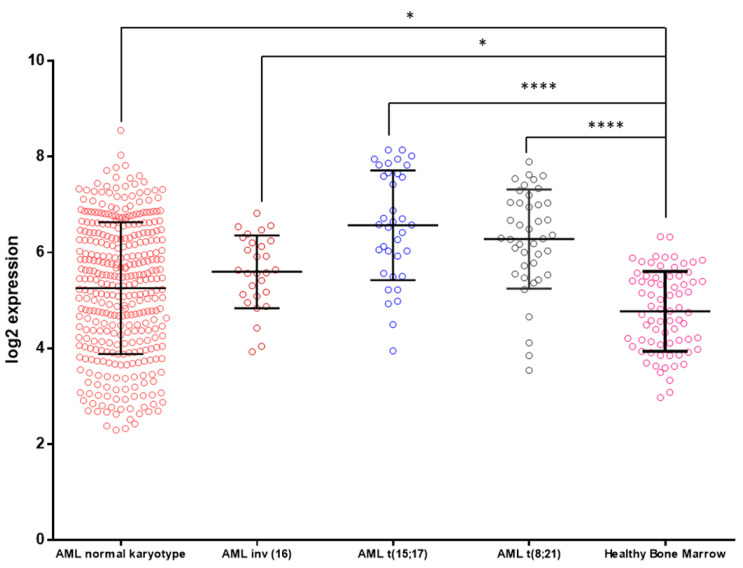
Figure 4.
KCTD15 expression in human AML samples. Microarray data of KCTD15 were obtained from the MILE study dataset (accession number GEO13159) and plotted as log2 transformed expression values. AML samples were classified as AML normal karyotype (mean = 5.26, SD = 1.38, n = 351 samples, red circles), AML inv (16) (mean = 5.60, SD = 0.75, n = 28 samples, Bordeaux circles), AML t(15;17) (mean = 6.57, SD = 1.14, n = 36 samples, blue circles), AML t(8;21) (mean = 6.28, SD = 1.03, n = 41 samples, black circles), and healthy bone marrow (mean = 4.77, SD = 0.83, n = 73 samples, pink circles). One-way ANOVA with Bonferroni’s multiple comparison test was applied; **** p < 0.0001, * p < 0.05.

