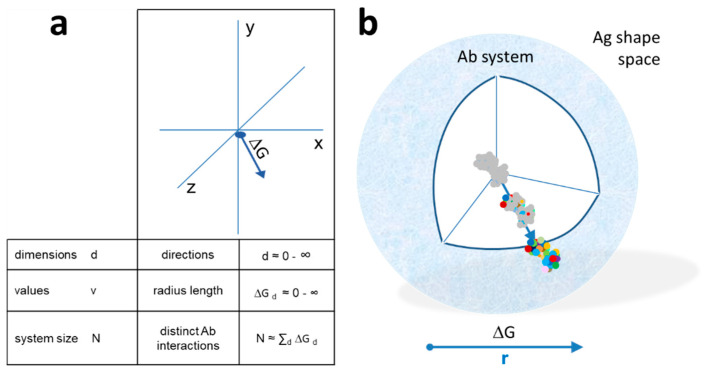
Figure 2.
Quantitative interaction space and B-cell differentiation. (a) The system of antibodies has a center as a reference point in a conceptual three-dimensional metric space of interactions. Structural diversity appears as directions (exemplary arrow) in Ag shape space. Distance is measured as the free energy change of antibody–antigen interaction. The total size of the system N is the sum of all interactions in all directions. (b) Diversity appears as we leave the center of the system, spherical shells representing various levels of resolution of molecular recognition. Colors represent distinct amino acids of antibody-binding site engaging in noncovalent bonding with the target molecule. Higher energy interactions engage more residues.

