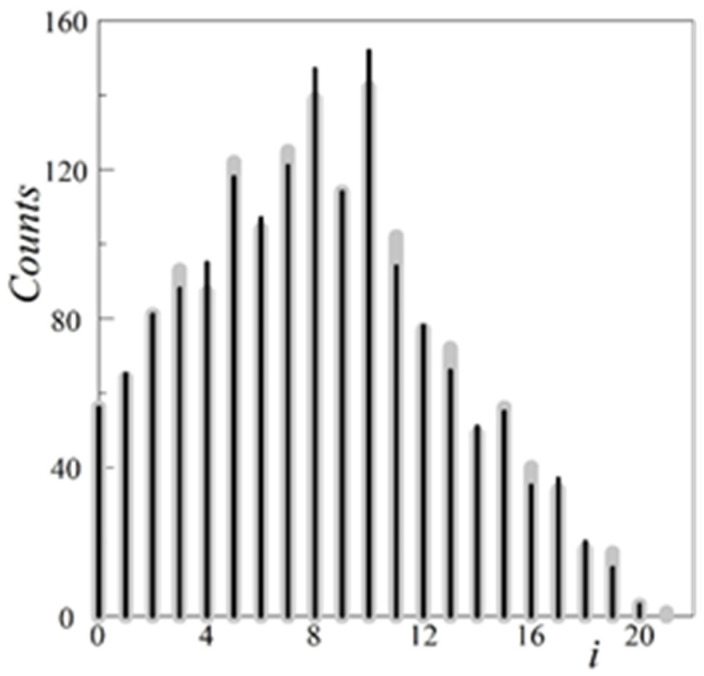
Figure 3.
The histograms of linear distances between the edge pixels, htarget(i), the drop black lines, and h(i), the drop gray lines, for the chosen target inclusion Figure 2a, and the related synthetic cluster from Figure 2b, respectively. The common value htarget(i = 0) = h(i = 0) corresponds to the number of the edge pixels.

