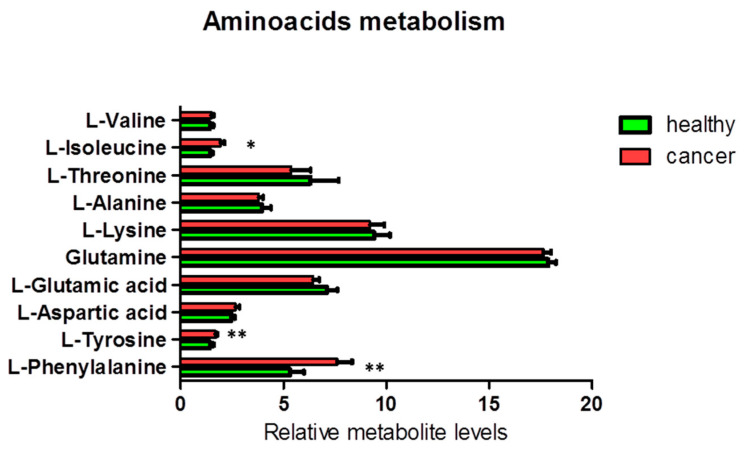
Figure 4.
Percentage of metabolites (nmoles of metabolite relative to total nmoles of metabolites per g of tissue) involved in the amino acid metabolism in thyroid cancer tissue (n = 11) and healthy thyroid tissues (n = 10). Values are mean ± SD; (*) indicates ANOVA F values with p < 0.05, and (**) indicates q < 0.05 when FDR correction is applied for multiple comparisons.

