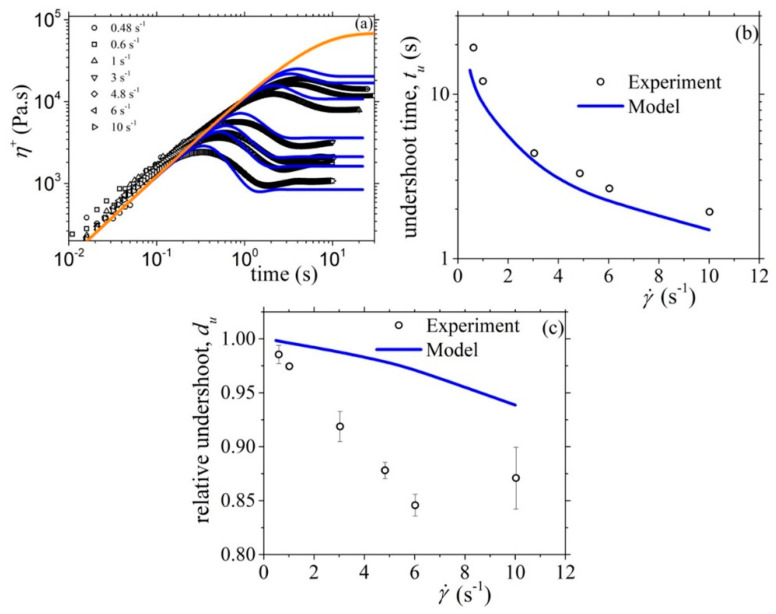
Figure 7.
Comparison of the model predictions with the experimental data considered in Ref. [17] for: (a) the growth of the shear viscosity, (b) the undershoot time, and (c) the relative undershoot, upon inception of shear flow. The thick orange line in Figure 7a depicts the LVE envelope, Equation (15a). Same parameter values as in Figure 6.

