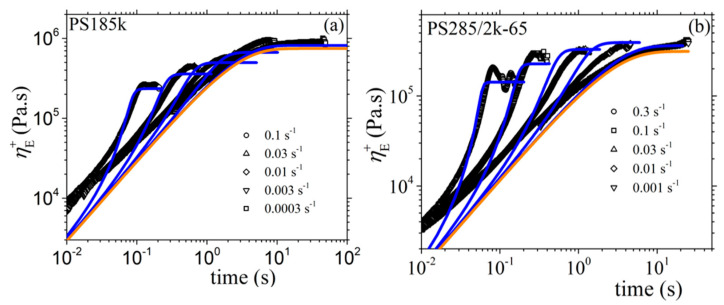
Figure 13.
Comparison of the model predictions with the experimental measurements of Costanzo et al. [16] for the extensional stress growth coefficient as a function of time for several stretch rates. The thick orange line depicts the LVE envelope, Equation (17). Same parameter values as in Figure 12.

