
Figure 3.
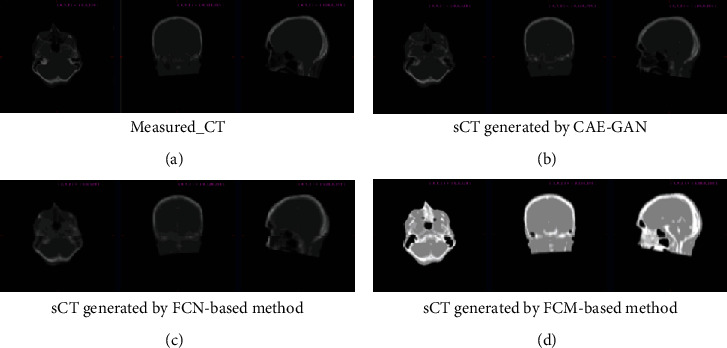
Results of different image synthesis algorithms on subject 1. (a) is the measured CT, and (b)–(d) are the synthetic CT generated by different methods. Each slice image is viewed from three perspectives, transverse, coronal, and sagittal, from left to right. It can be seen that (b) is the closest to the measured CT with high synthesis accuracy and quality.