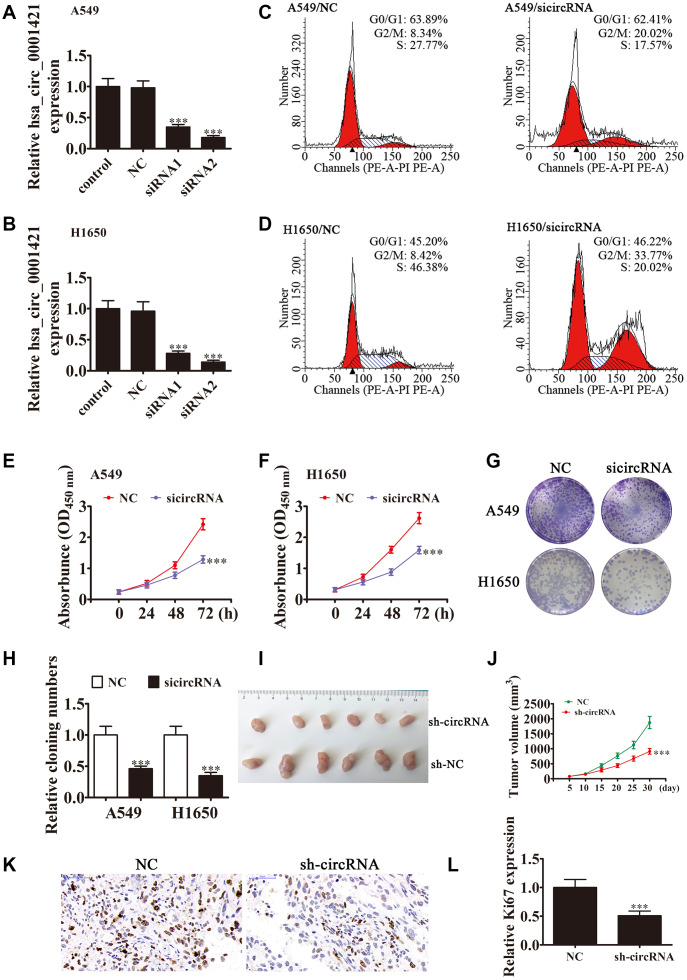
Figure 2.
Downregulation of circ-SEC31A suppressed NSCLC proliferation both in vitro and in vivo. (A and B) RT-qPCR detection showing the expression of circ-SEC31A in both A649 (A) and H1650 (B) cells after transfection with siRNA against circ-SEC31A (si-circRNA) or negative control (NC). Data are presented as mean ± SD; ***P<0.001 vs. the normal group. (C and D) Flow cytometry detection showing the percentages of cells in G1, S, or G2 phase in both A549 (C) and H1650 (D) cells. (E and F) CCK8 assays were used to evaluate cell proliferation. Data are presented as mean ± SD; ***P<0.001 vs. NC. (G and H) Colony formation assay showing proliferation in both A549 and H1650 cells. Data are presented as mean ± SD; ***P<0.001 vs. NC. (I and J) Xenograft tumor studies. A549 cells transfected with NC or sh-circRNA were subcutaneously injected into nude mice, and tumor growth curves were plotted. Data are presented as mean ± SD; **P<0.01, ***P<0.001 vs. NC. (K) Immunohistochemistry showing the percentage of Ki-67-positive cells. (L) The relative levels Ki-67-positive cells were calculated. Data are presented as mean ± SD; ***P<0.001 vs. sh-NC.

