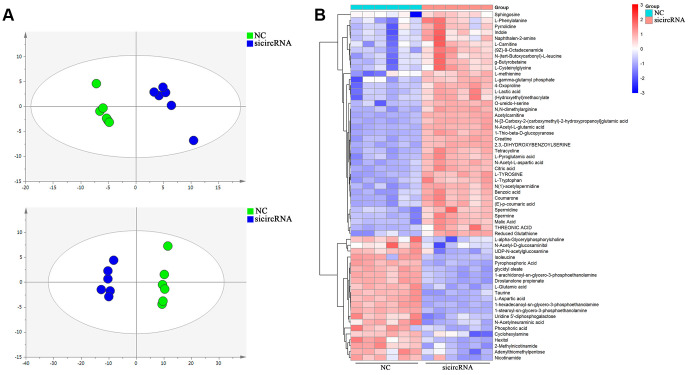
Figure 4.
Cell metabolites analysis showing the effect of circ-SEC31A on NSCLC cell metabolites. (A) OPLS-DA score plot showing the difference between the si-circRNA and NC groups of A549 cells. (B) Heatmap identifying metabolites in A549 cells. Colors in the heatmap change with the metabolite contents, red indicates high content, while blue indicates low content.

