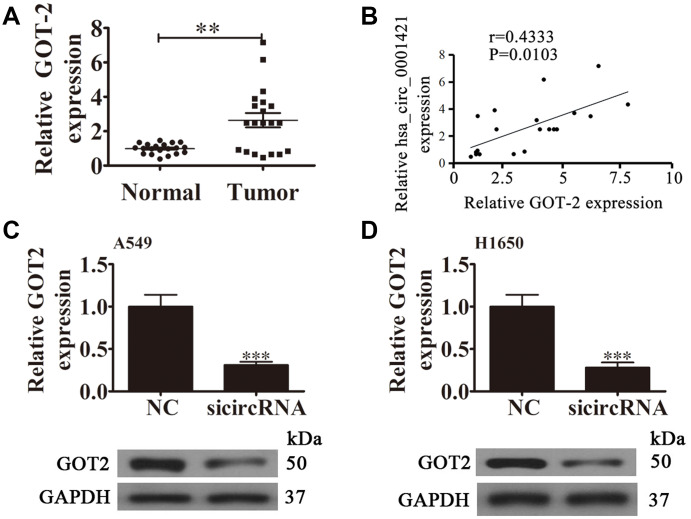
Figure 6.
The relationship between circ-SEC31A and GOT2. (A) RT-qPCR showing the relative GOT2 expression from 20 NSCLC tumor tissues and adjacent non-tumor tissues. Data are presented as mean ± SD; **p<0.01. (B) A significant positive correlation between circ-SEC31A and GOT2 was detected in NSCLCs tissues; n=20, P=0.0103. (C and D) RT-qPCR and western blot detection showing the expression of GOT2 in both A549 (C) and H1650 (D) cells. Data are presented as mean ± SD; ***P<0.001 vs. NC.

