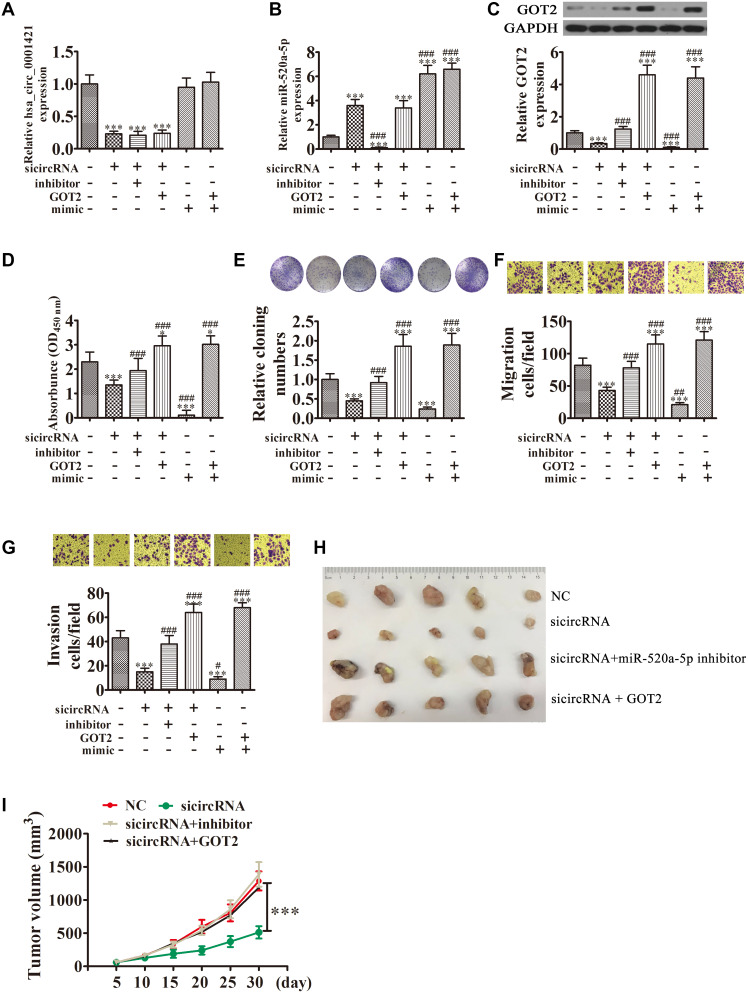
Figure 8.
Overexpression of miR-520a-5p or downregulation of GOT2 reversed the suppressive effect of circ-SEC31A silencing on NSCLC cell proliferation, invasion, and migration. (A and B) RT-qPCR detection showing the expression of circ-SEC31A and miR-520a-5p in A649 cells. Data are presented as mean ± SD; ***P<0.001 vs. NC; ###P<0.001 vs. si-circRNA. (C) Western blot analysis showing the expression of GOT2 in A649 cells. Data are presented as mean ± SD; ***P<0.001 vs. NC; ###P<0.001 vs. si-circRNA. (D) CCK8 assays were used to evaluate cell proliferation after 72 h culture. Data are presented as mean ± SD; *P<0.05, ***P<0.001 vs. NC; ###P<0.001 vs. si-circRNA. (E) Colony formation assays showing the proliferation of A549 cells. Data are presented as mean ± SD; ***P<0.001 vs. NC; ###P<0.001 vs. si-circRNA. (F and G) Cell migration (E) and invasion (F) were assessed in A549 cells using Transwell assays. Data are presented as mean ± SD; ***P<0.001 vs. NC; #P<0.05, ##P<0.01, ###P<0.001 vs. si-circRNA. (G) Xenograft tumors in nude mice from the four treatment groups (NC, si-circRNA, si-circRNA + miR-520a-5p inhibitor, si-circRNA + GOT2) after subcutaneous injection of A549 cells. (H, I) Xenograft tumor volumes from the four treatment groups were measured at the indicated time points. Data are presented as mean ± SD; ***P<0.001.

