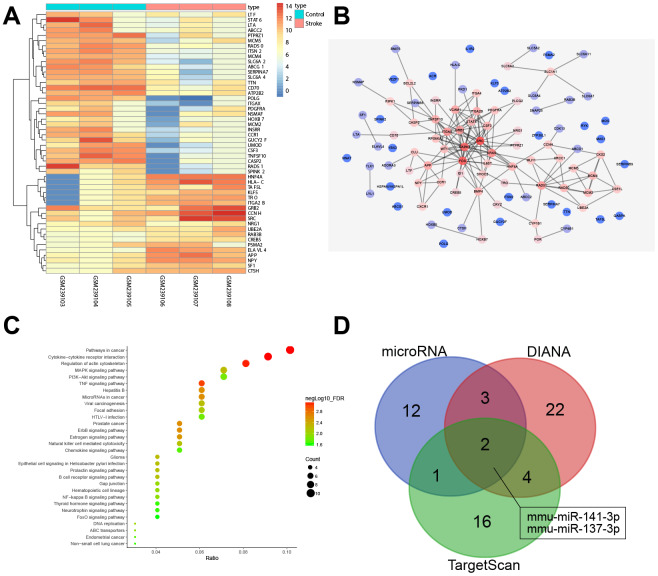
Figure 1.
miRNA and mRNA expression profiles in ischemic stroke. (A) a heat map of the expression of the first 50 DEGs in ischemic stroke-related microarray data GSE9391. The colored column represents the sample number, the row name indicates the DEGs, each rectangle in the graph corresponds to the expression value of a sample, red indicates high expression and blue indicates poor express; (B) PPI network for the DEGs in ischemic stroke. The color of genes indicates the degree of association with other genes and, if a gene has more interacting genes, the core degree of the gene in the network and the correlation degree will be higher; red indicates high association and blue indicates low association; (C) enrichment analysis of KEGG for DEGs in ischemic stroke; the abscissa represents gene ratio and the coordinate represents KEGG enrichment item; the right histogram represents color gradation; (D) comparisons among miRNAs targeting Src by DIANA, TargetScan and microRNA. Two miRNAs were located at the intersection of the three databases (mmu-miR-141-3p and mmu-miR-137-3p).

