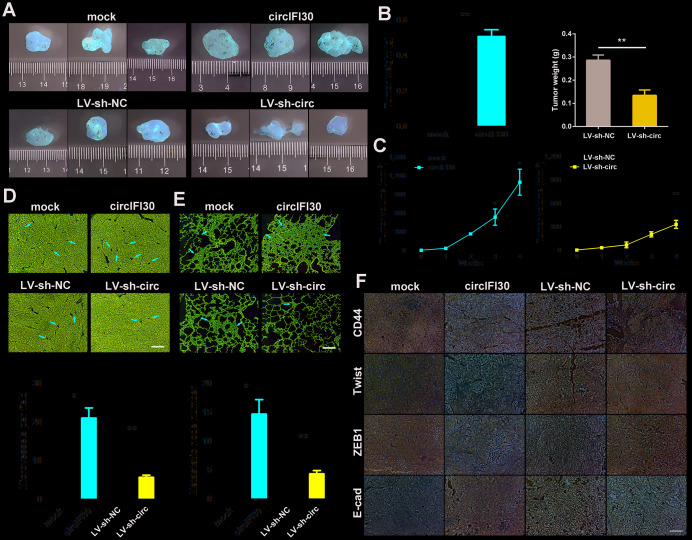
Figure 5.
circIFI30 facilitates tumorigenesis and metastasis of TNBC cells in vivo. (A, B) Representative images of xenograft tumors of each group and tumor weight analysis were shown. (C) Growth curves of xenograft tumors were measured once a week. (D, E) HE staining of tumor and lung sections were showed. The microvessels of the tumors and metastatic nodules of the lungs were indicated by arrows (magnification, × 100, scale bar, 100 μm). (F) IHC staining was applied to analyze the protein levels of CD44 and EMT-related molecules (magnification, × 200, scale bar, 100 μm). Data were indicated as mean ± SD, *P < 0.05, **P < 0.01, ***P < 0.001.

