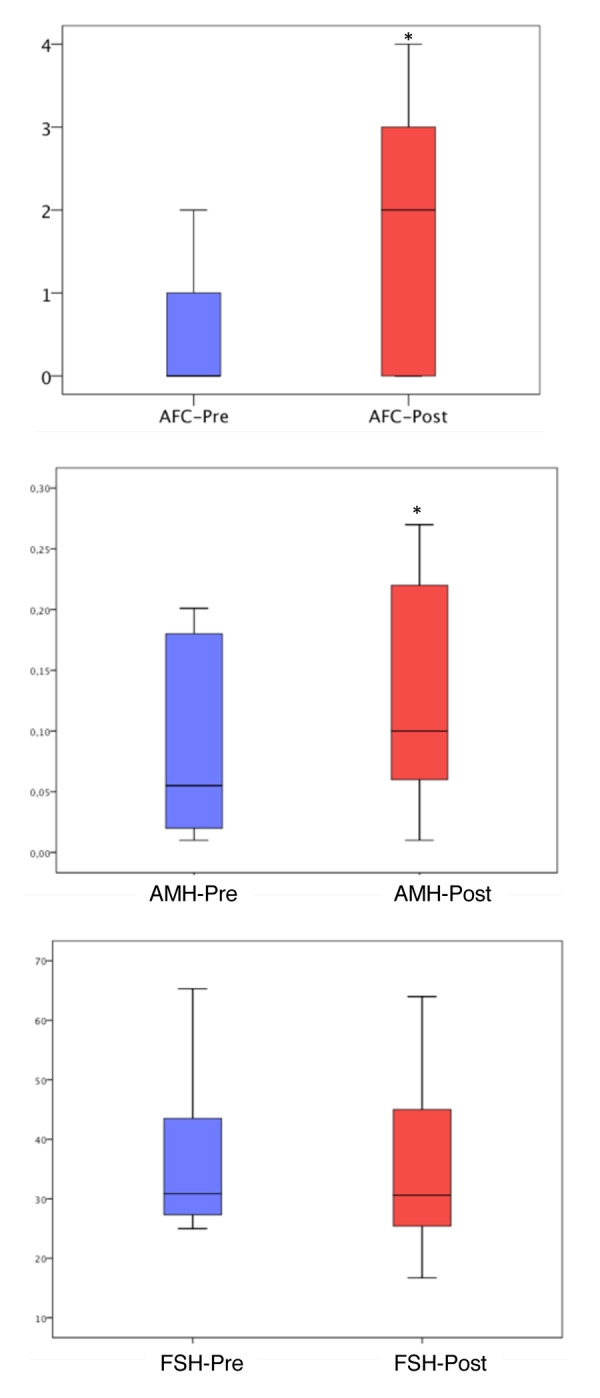
Figure 2.

Antral follicle count, AMH and FSH levels before and after PRP injection. The ends of the boxes are the upper and lower quartiles, so the box spans the interquartile range (25th to 75th percentile). The horizontal line inside the boxplot represents the median value. The whiskers extend between 5%-95%. *: P<0.05
