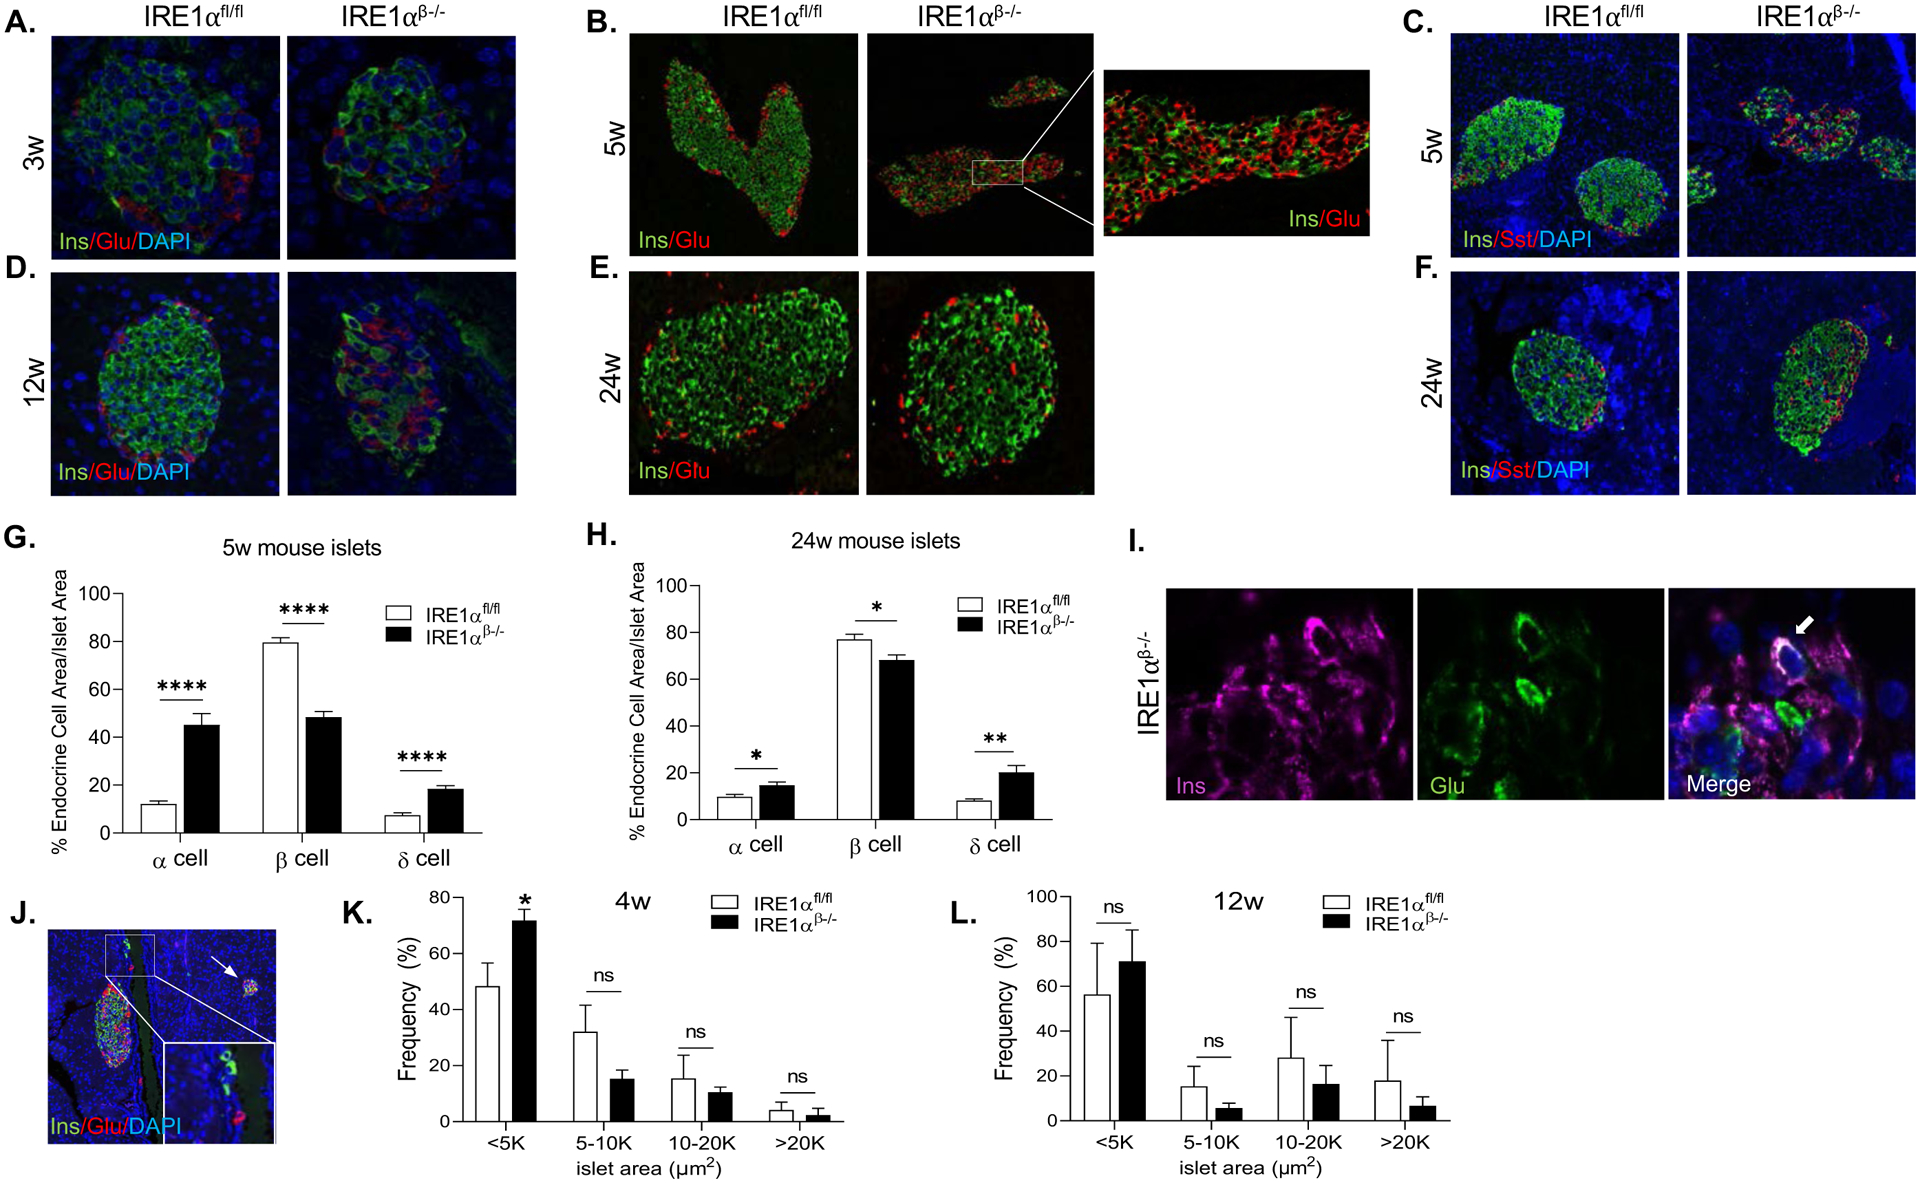
Figure 3. Islet cell composition is altered in IRE1αβ−/− mice during the hyperglycemic phase.

(A and B) Representative immunofluorescence images for insulin and glucagon expression at indicated time points.
(C) Representative immunofluorescence images for insulin and somatostatin expression at 5 weeks of age.
(D and E) Representative immunofluorescence images for insulin and glucagon expression at indicated time points.
(F) Representative immunofluorescence images showing insulin and somatostatin expression at 24 weeks of age.
(G and H) Quantification of α, β, and δ-cells as a percentage of total islet area at 5 and 24 weeks of age (15–25 islets/animal/time point).
(I) Representative image of an insulin+ and glucagon+ bihormonal cell in an islet of IRE1αβ−/− mice. Arrow indicates the bihormonal cell.
(J) Representative image of a pancreatic section from 5-week-old IRE1αβ−/− mice showing the presence of single β-cells and small islet clusters. The arrow points to a small islet cluster.
(K and L) The quantification of islet area of 4 weeks and 12 weeks of age IRE1αfl/fl (n = 3 per time point) and IRE1αβ−/− (4 weeks: n = 3; 12 weeks: n = 4) mice.
All data are represented as mean ± SEM, with statistical analysis performed by Student’s t test (****P < 0.0001, **P < 0.01, *P < 0.05). w: weeks.
